

Account-level numbers hide the thing you most need to know: which products are actually carrying the business, and which are only selling because you are paying for them.
Analytics → Sales Performance answers that per product.
Prefer to watch? A minute on reading total sales against ad sales.
The headline tiles

The same six as the advertising screens — Total Spend, Ad Sales, ROAS, ACoS, Impressions, Clicks — for your whole catalogue over the selected period, each with its trend and its change.
Performance trends
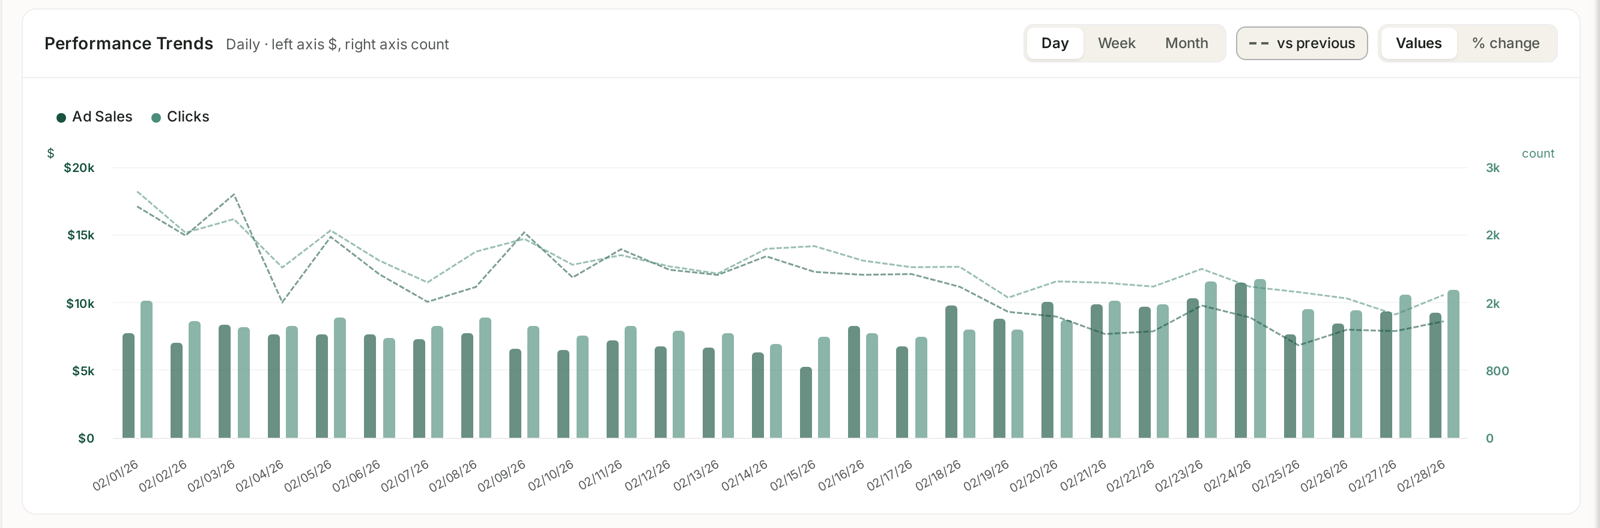
Ad sales against clicks, money on the left axis and counts on the right, with the usual Day / Week / Month and Values / % change controls.
The table, and the comparison that matters
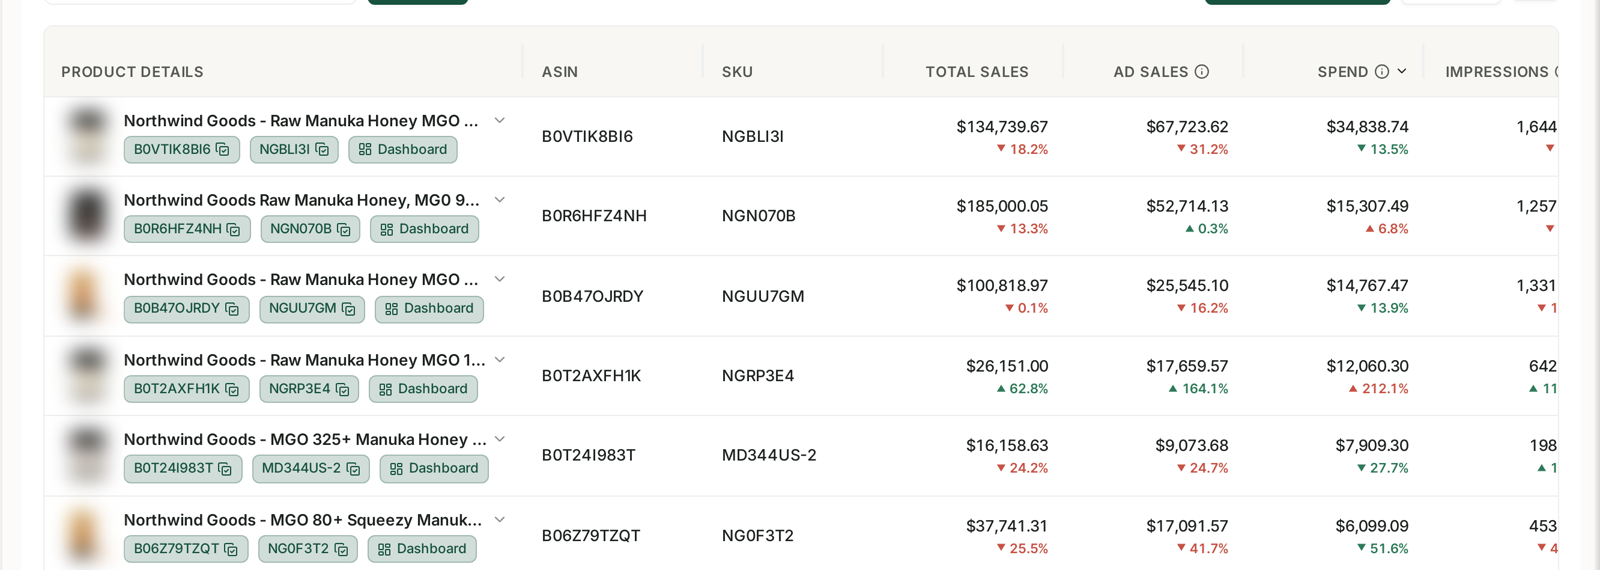
Every product with its ASIN, SKU, and then the two columns to read together: Total Sales and Ad Sales.
The gap between them is your organic business.
| What you see | What it means | What to do |
|---|---|---|
| Ad sales are nearly all of total sales | the product is renting its position | test reducing spend and watch what survives |
| Total sales well above ad sales | genuine organic demand | protect it — this is a product worth defending |
| High spend, low total sales | you are buying sales that are not compounding | fix the listing or stop |
That first row is the one worth acting on. A product whose sales collapse when you stop advertising never really had demand — it had a budget. Knowing which of your products those are changes how you allocate spend.
TACoS, per product
Spend divided by total sales is that product's TACoS — its true advertising cost, not just its cost against attributed sales.
ACoS tells you how efficient a campaign was. TACoS tells you how dependent a product is. A product with a respectable ACoS and a rising TACoS is quietly becoming more expensive to sell, and ACoS alone will never show you that.
How to use it in practice
Find your gateway products. Sort by total sales. The top few are your business — make sure they are never out of stock and never under-advertised.
Find the renters. Look for products where ad sales approach total sales. Test a spend reduction on one and watch for two weeks.
Find the ignored. Products with real total sales and almost no ad spend are already working without help. Modest advertising on them often returns better than more spend on products you are already saturating.
Where to go next
For which products bring new customers rather than repeat ones, the AMC Cloud NTB ASINs dashboard answers that directly. For whether a product is winning the searches it should, see Search Query Performance.
Related
- Product Ads: ASIN-Level Ad Performance — the advertising view of the same ASIN.
- Find Zero-Sales ASINs and Decide What to Do With Them — the playbook for the tail.
- How to Monitor Your Stock Levels — the inventory side.