

Branded PPC is the hardest spend in the account to justify, because the counterfactual is invisible. If you stop bidding on your own brand name, do you lose those sales — or would they have come anyway?
Branded market share is the metric that answers it, and the answer only appears as a trend, not as a snapshot.
Prefer to watch? One hundred and fifty-six seconds on defining brand terms correctly, building four weeks of baseline, and testing branded spend against the share trend.
What branded market share means here
Of all the purchases made on search terms containing your brand, what share went to you?
If it sits near 100%, you already own that traffic — and paying for it may be buying sales you would have had for free.
If it drops when you reduce branded spend, the spend was defending something real.
That is the feedback loop. Without it, branded budget is argued about rather than decided.
Step 1: define what counts as branded
List the brand terms — your brand name and its common misspellings. Nothing else.
Do not list product phrases. If your brand is Northwind, you list northwind. You do not list northwind blanket, northwind sheets, or any other product-modified variant.
Because the rule is containment: any search term containing your brand token is flagged as branded, and the modified phrases are caught automatically. Listing them separately only creates gaps and double-counting.
Add misspellings, which are common in branded search and easy to miss.
Set this up once, and revisit it only when the brand itself changes.
Step 2: pull the branded view weekly
Brand Analytics → Search Query Performance → Brand view, weekly.
Weekly, not monthly. The whole point is to see a trend responding to a change you made, and a monthly cadence gives you four data points a year.
Every week, you want the same three things:
Top branded search terms and their purchases.
Top non-branded terms and their purchases.
Branded versus non-branded totals, in both absolute and percentage terms.
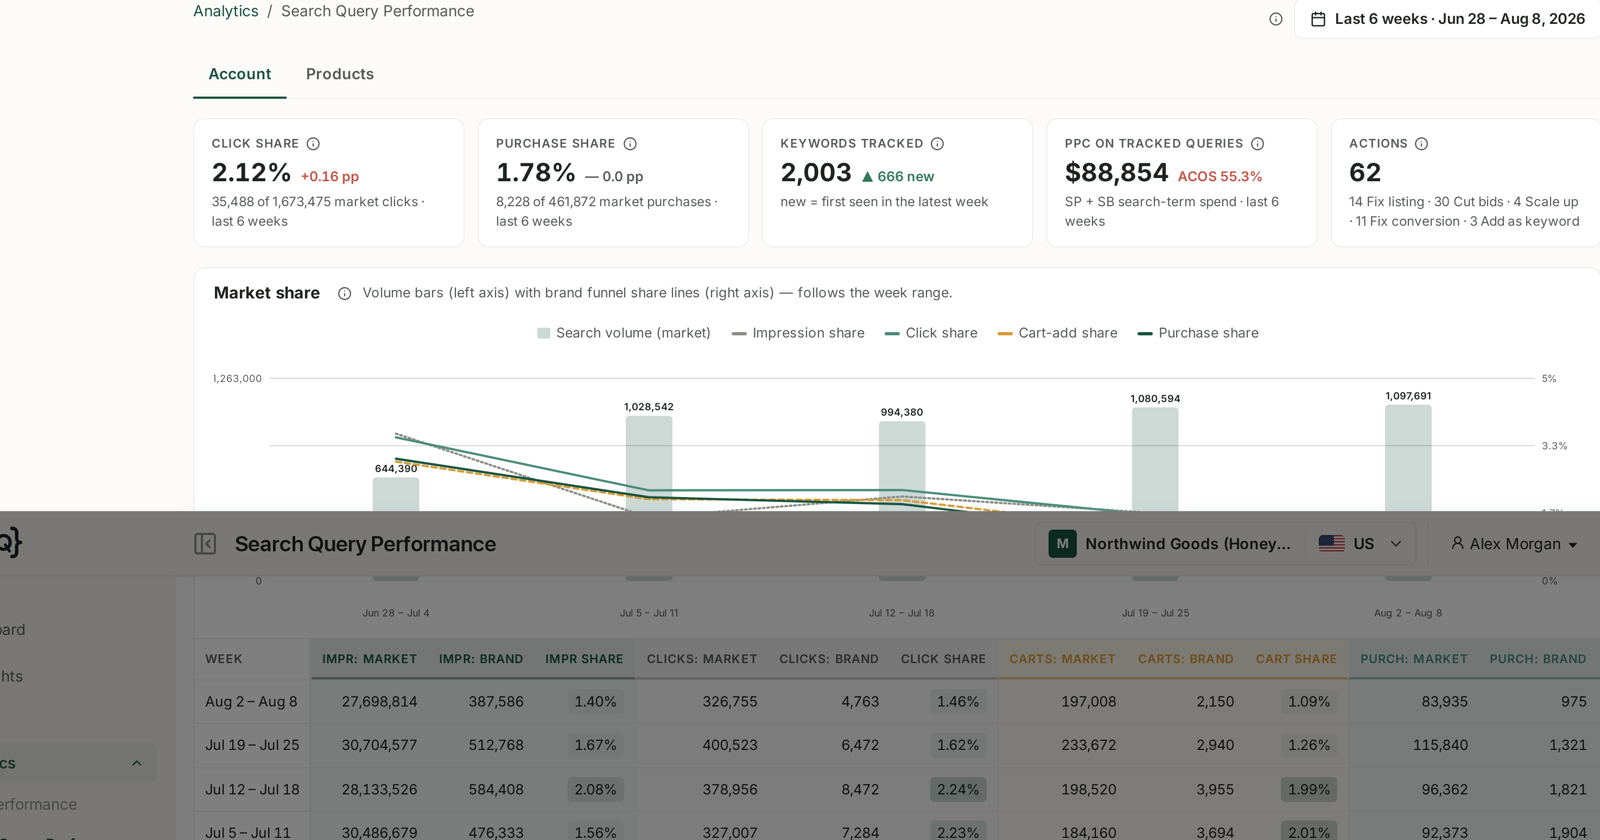
Classifying every query as branded or non-branded and tracking the split week over week is the entire measurement — see Generic, Branded and Competitor Terms and Understanding Search Query Performance. The manual version is a fresh export, a fresh sheet tab and a manual paste every single week — which is exactly the kind of task that gets done for six weeks and then quietly stops.
Step 3: establish a baseline before changing anything
Four weeks minimum, with branded spend unchanged.
One week tells you nothing. You need to know what normal variation looks like before you can recognise a response.
Most established brands sit somewhere between 80% and 100% on branded market share. Where you sit is less important than how stable it is.
Step 4: then test
Change branded spend deliberately, and watch the chart.
If your branded share is already very high
Reduce branded PPC spend and watch.
Share stays flat → the spend was buying sales you were getting anyway. Move that budget to non-branded terms, where it buys incremental customers.
Share falls → the spend was defending real ground. Put it back.
If your branded share is lower than you expected
Someone else is converting your brand searches — usually competitors bidding on your name.
Then branded spend is genuinely defensive, and the question becomes how much it takes to hold the position rather than whether to spend at all. See How Much to Spend on Branded Keywords.
Read it as a trend, not a number
Change one thing at a time, or you cannot attribute the movement.
Give each test three or four weeks. Branded search volume is seasonal and lumpy; a single week's dip is usually noise.
And watch non-branded purchases at the same time. Branded share rising while total non-branded purchases fall is not a win — it usually means you have simply got smaller.
Why this is worth the effort
Branded terms convert extremely well, which makes branded campaigns look excellent on ACOS and makes them very easy to over-fund.
A campaign with a 5% ACOS is not automatically a good campaign. If those buyers were coming anyway, its true incremental ACOS is infinite.
This tracker is the only practical way to find out — see Profit Campaigns and Ranking Campaigns.
Common mistakes
Listing product phrases as brand terms, which breaks the classification.
Forgetting misspellings, and under-counting branded traffic.
Judging on one week, before a baseline exists.
Changing branded spend and something else at the same time.
Reading branded share alone, without watching non-branded purchases beside it.
Assuming a low branded ACOS proves the spend is working.
Related
- How Much to Spend on Branded Keywords — the decision this measurement informs.
- Generic, Branded and Competitor Terms — the classification underneath it.
- Understanding Search Query Performance — the report this all runs on.