

Some of your products sell to people who already know you. Others bring in customers who have never bought from your brand before. NTB ASINs Analysis tells you which is which — and the answer is rarely the product you would guess.
Those first-purchase products are your gateway ASINs, and they deserve to be funded differently from everything else in the catalog.
Prefer to watch? Seventy-nine seconds on gateway products, and why rate and volume disagree.
Where it lives
AMC Cloud opens on a grid of seven dashboards. This one is the first card.
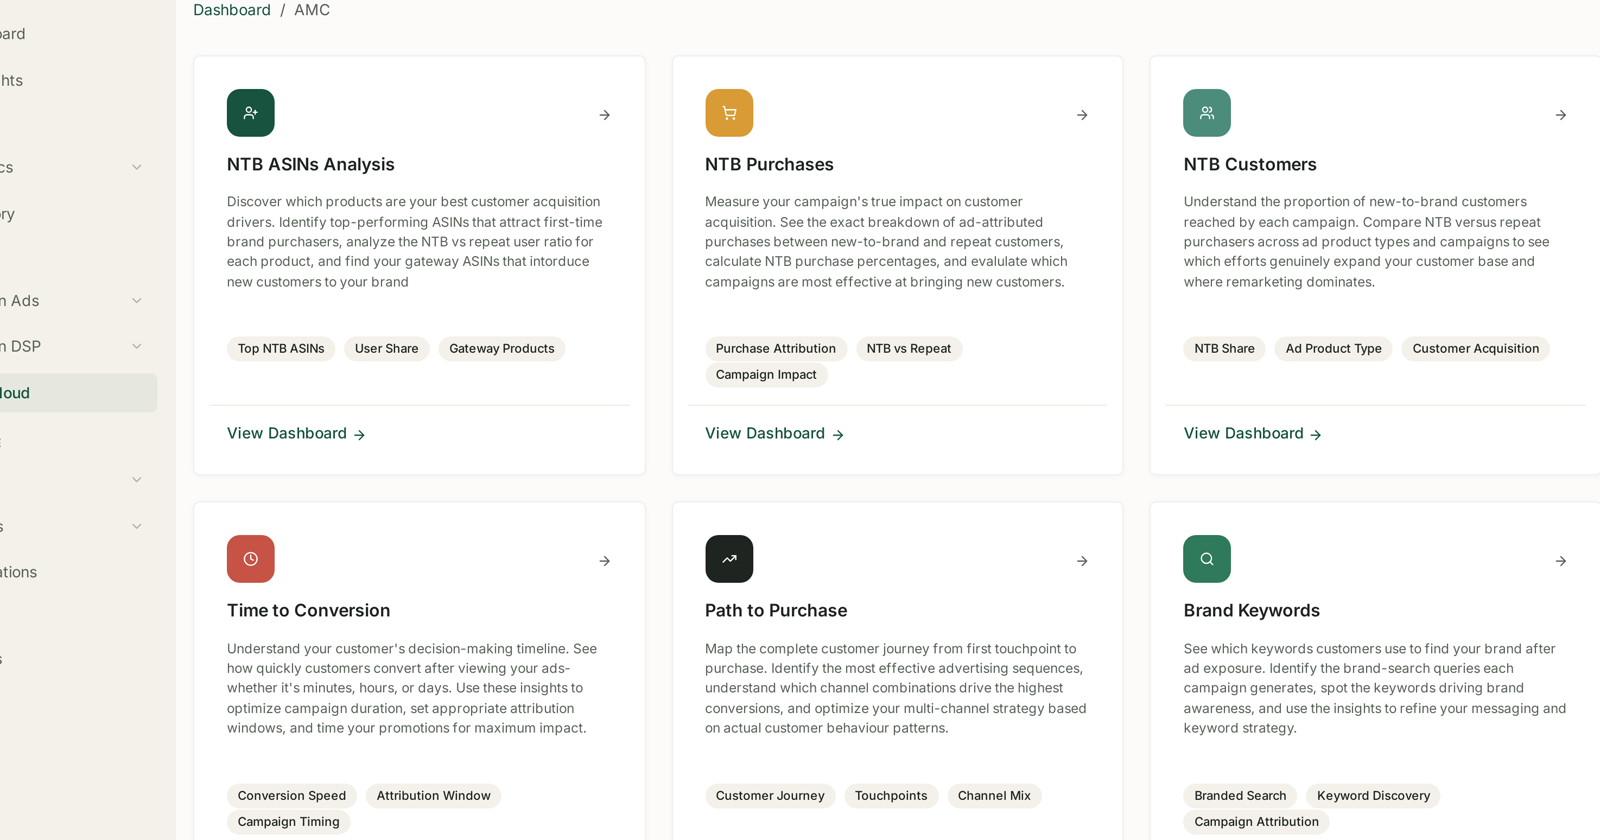
Like every AMC dashboard it reports one calendar month at a time — the date control top-right selects the month, not a free range. See Why AMC Data Is Monthly and Sometimes Empty.
The definition it uses
The dashboard states it plainly:
Customers are considered new-to-brand (NTB) if they purchase from your brand for the first time during the previous 365-day period on Amazon.
Brand-level, 365 days, and measured against all of Amazon — not just your ads. Somebody who bought from you organically eleven months ago is not new to brand, however they arrive this time.
The headline numbers
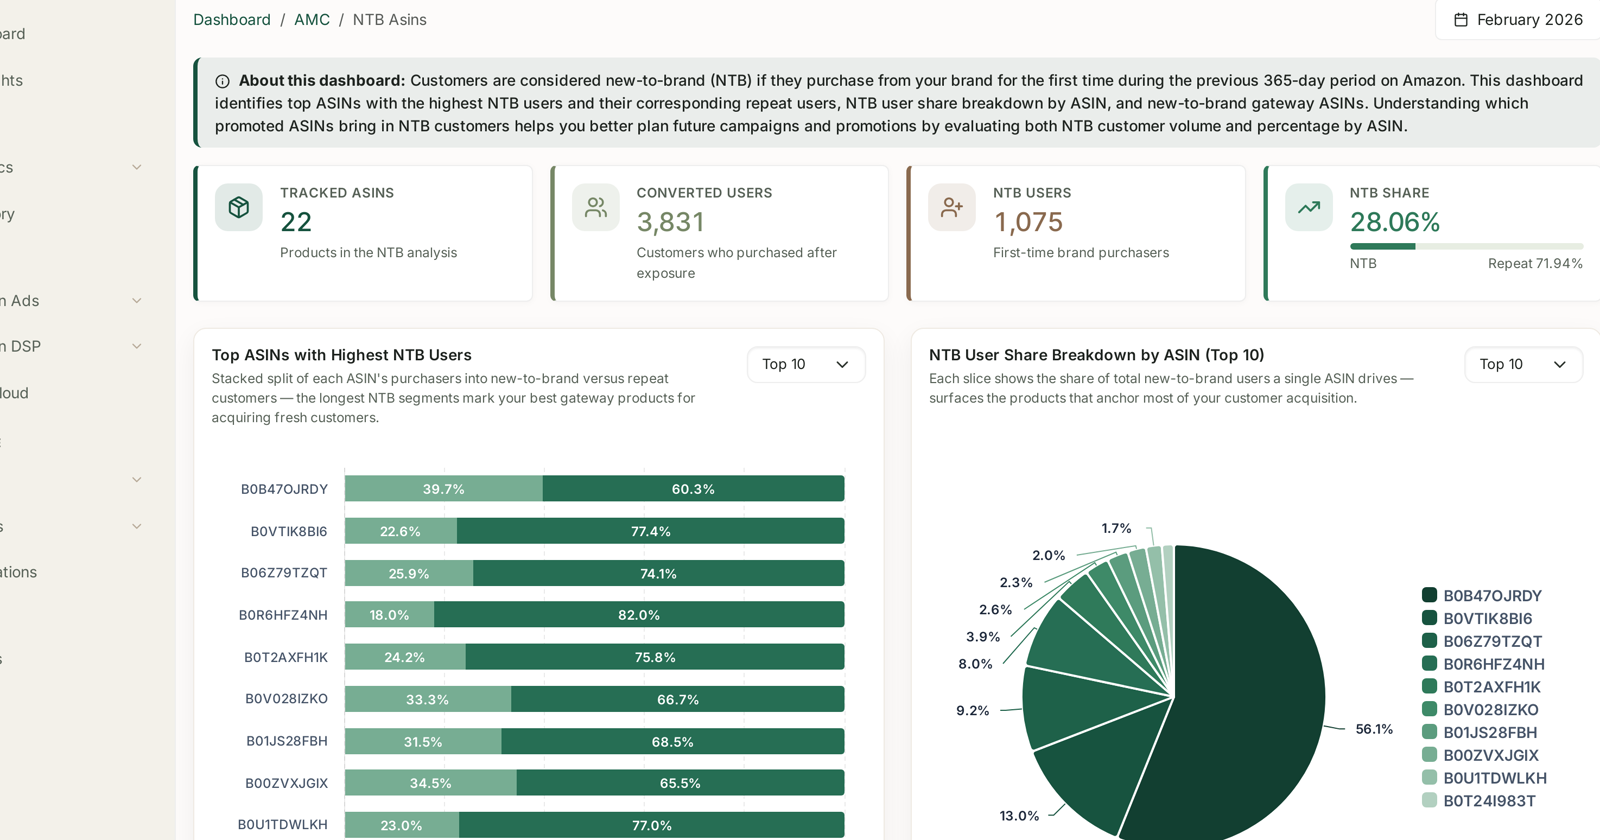
| Tile | Reads |
|---|---|
| Tracked ASINs | products in the NTB analysis |
| Converted Users | customers who purchased after ad exposure |
| NTB Users | first-time brand purchasers among them |
| NTB Share | NTB as a percentage, with repeat beside it |
NTB Share is the number to anchor on, and a figure around 28% is unremarkable for an established brand — roughly one buyer in four is new. A brand-new catalog would sit far higher; a mature, heavily-remarketed one lower.
Top ASINs with Highest NTB Users
Stacked split of each ASIN's purchasers into new-to-brand versus repeat customers — the longest NTB segments mark your best gateway products for acquiring fresh customers.
Each bar is one ASIN, split into NTB and repeat.
Check the legend before you read the bars. The three NTB dashboards do not agree with each other on which colour or which side means NTB. On this one, NTB Users is the lighter segment, on the left. On NTB Purchases the NTB segment is darker and on the right. Reading one dashboard's convention into another inverts your conclusion completely.
A useful sanity check: the per-ASIN NTB percentages should average out to roughly the headline NTB Share tile. If your reading gives a set of bars averaging 70% against a headline of 28%, you have the segments backwards.
NTB User Share Breakdown by ASIN
Each slice shows the share of total new-to-brand users a single ASIN drives — surfaces the products that anchor most of your customer acquisition.
This is the chart that changes budgets, because acquisition is almost always far more concentrated than people expect. A single ASIN accounting for 56% of every new customer the brand acquired that month is not unusual.
The product table underneath
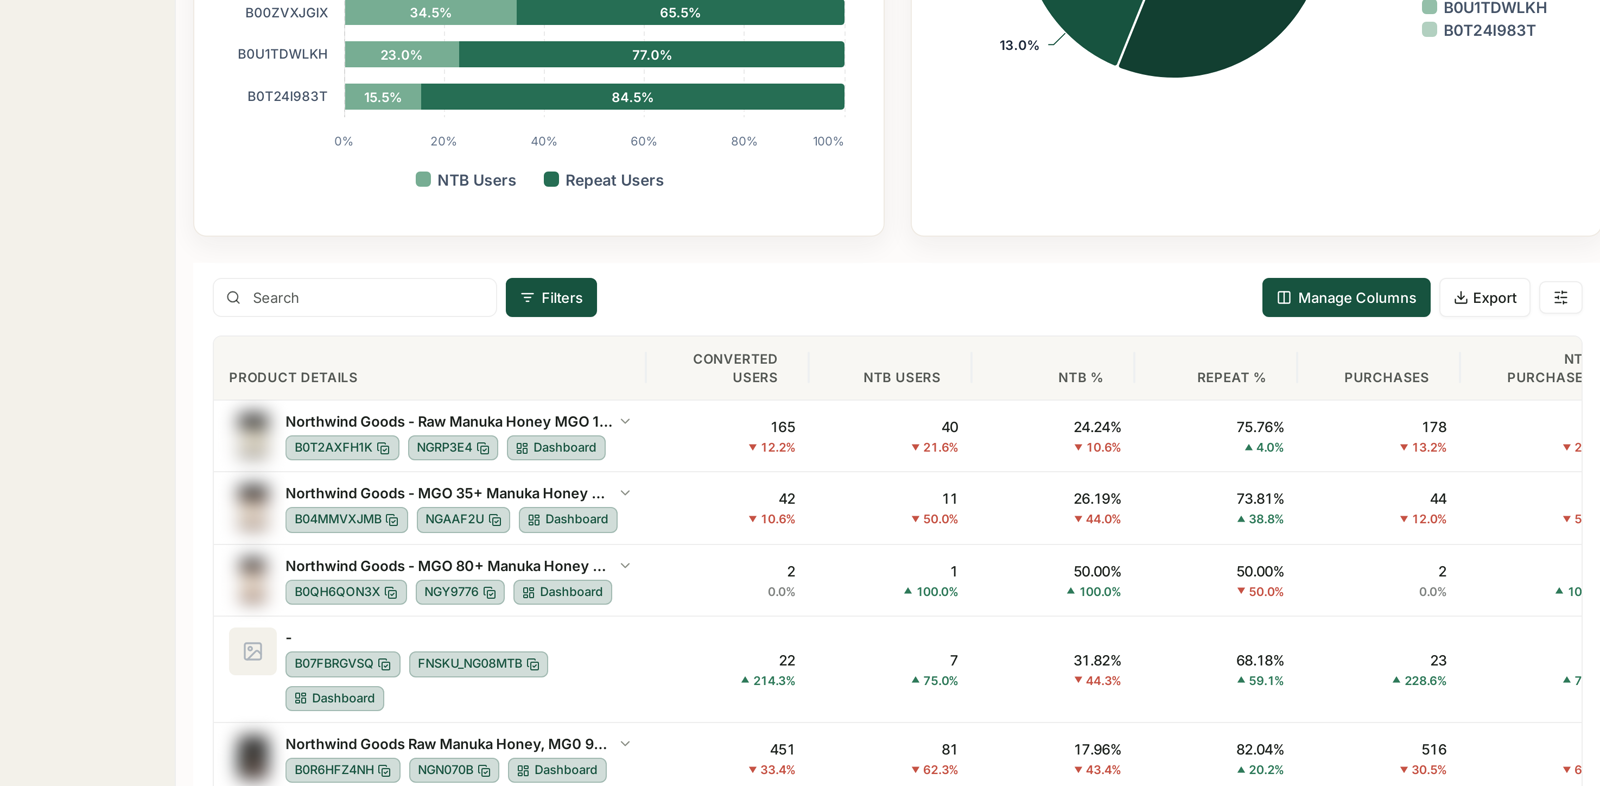
Below the charts, every tracked product is listed with Converted Users · NTB Users · NTB % · Repeat % · Purchases, each with its change against the previous month, plus the usual Search, Filters, Manage Columns and Export.
Each row carries the ASIN and seller SKU, and a Dashboard chip that jumps straight to that product's page — which is the quickest route from "this is a gateway product" to "so what is its stock cover?"
Rate and volume are different questions
The two charts answer different things, and confusing them is the main way this dashboard gets misread:
| Chart | Question | Best product is |
|---|---|---|
| Stacked bars | what proportion of this ASIN's buyers are new? | the highest rate |
| Pie | what share of all new customers does this ASIN bring? | the highest volume |
A niche product can be 80% new-to-brand and still contribute 2% of your new customers, because almost nobody buys it. It is a genuine gateway with no traffic. The hero ASIN might be only 35% NTB and still deliver half your acquisition, simply because it sells.
Fund the volume; protect the rate. Concentration is the risk worth naming: if one ASIN brings most of your new customers, a stock-out on that ASIN is not a sales problem for one product — it is an acquisition outage for the whole brand. See Catch a stockout before it costs you rank.
What to do with it
Never let a gateway ASIN go out of stock. Set its inventory cover threshold higher than the rest of the catalog.
Bid differently on gateway products. A higher ACoS is defensible on a product that recruits customers, because the return arrives on their second and third orders — not on the one you paid for. See Understanding ROAS and Key Amazon Advertising Metrics.
Check your entry price. Gateway ASINs are frequently the cheapest or smallest pack. If yours is not, ask whether a trial size would recruit faster.
Re-read it after a launch. A new product can quietly become the gateway within two months, and the budget usually takes far longer to notice.
What not to conclude
NTB is not incrementality. The customer was new to your brand. It does not prove the ad caused the purchase.
A low NTB share is not failure. For a brand with strong repeat purchase it is a sign of a healthy base. Read it beside repeat volume, not alone.
One month is one month. AMC reports monthly cohorts, and seasonality moves NTB share sharply. Compare the same month year on year where you can.
Related
- NTB Purchases: New Business by Campaign — the same question asked of campaigns.
- NTB Customers: New vs Repeat, Counted as People — the third NTB view, and how it differs.
- What 'New to Brand' Actually Means — the definition in full.
- Why AMC Data Is Monthly and Sometimes Empty — the reporting cadence.