

Fifty product ideas is an unrankable list. Everything looks plausible at a glance, and choosing by instinct means choosing the one you happened to look at when you were feeling optimistic.
Scoring fixes that. Every market gets the same data points, each contributes a weighted score, and the list sorts itself.
Prefer to watch? One hundred and thirty seconds on what a score is actually for, the margin column that overrides everything else, and the four reasons to promote a lower-scoring idea.
What scoring is for
It is not a verdict. A score does not tell you a product will work. It tells you which markets are worth spending an hour on, out of fifty you cannot possibly analyse deeply.
Scores are relative to your own list. There is no universal "good score", because markets vary enormously between categories. A 62 might be your best idea or your worst. The question is always: how does this rank against the other forty-nine?
The data that comes from the export
Search the market's main keyword on Amazon, export the results, and the mechanical columns fill themselves: revenue per listing, review counts, price points, seller types, fulfilment method.
This is where the "high revenue, low reviews" signal becomes numeric rather than an impression.
The data you fill in yourself
The manual columns are the ones that decide the score, and they are why this takes real time.
Economics
Expected selling price — what the market supports, from the current listings.
Estimated landed COGS — product plus freight.
FBA fulfilment fee — driven by size and weight, and often the difference between a viable product and a dead one.
Can you afford a better offer at 35%+ margin? The single most important column. If the answer is no, nothing else on the row matters.
Demand
Search volume over the past 360 days.
Search volume growth over the past 180 days. Direction matters as much as size — a smaller growing market beats a larger shrinking one.
Competition, in the top 10
How many Amazon-owned listings. More than five is usually disqualifying.
How many FBM listings. Merchant-fulfilled competitors are generally easier to beat on delivery.
How many overseas manufacturer-direct sellers. They compete on price in ways you often cannot.
How many strong sellers, and how many distinct sellers. A market split across ten sellers is more open than one split across three.
Product characteristics
Differentiation potential — can you offer something meaningfully better?
Is it a variations market? Variations capture more keywords on one listing and give you upsell paths.
Subscribe & Save eligibility and reorder frequency — repeat purchase changes the lifetime value of every customer you win.
Seasonality — evergreen demand is far kinder to cash flow and inventory planning.
Brand fit, 1–10 — would your existing customers expect to see this from you?
Risks
Existing patents.
Trendy in the last 4–8 months — a spike you might be arriving at the end of.
Restricted or problematic categories — compliance burden that can stop a launch entirely.
Weighting
Each column is capped according to how much it matters. Margin potential and competition carry more weight than, say, variation options, because they are more often the thing that kills a product.
The output is a single comparable number per market.
Take the top 15 — and override deliberately
Sort by score, mark the top 15, and move them to the next stage.
Then allow yourself to promote a lower-scoring idea, if you have a specific reason. The score is a summary, and summaries miss things. Legitimate reasons to override:
You have a genuine differentiator nobody in that market offers.
You have an inactive listing with existing reviews you could relaunch as a variation — a real head start the score cannot see.
You can source it unusually cheaply, changing the margin maths.
You can engineer the size or weight down to cut FBA fees where competitors have not. Fee advantages are durable competitive advantages, and they are routinely ignored.
What is not a legitimate reason: liking the product. That is the exact bias the scoring exists to remove.
Validating demand from real data
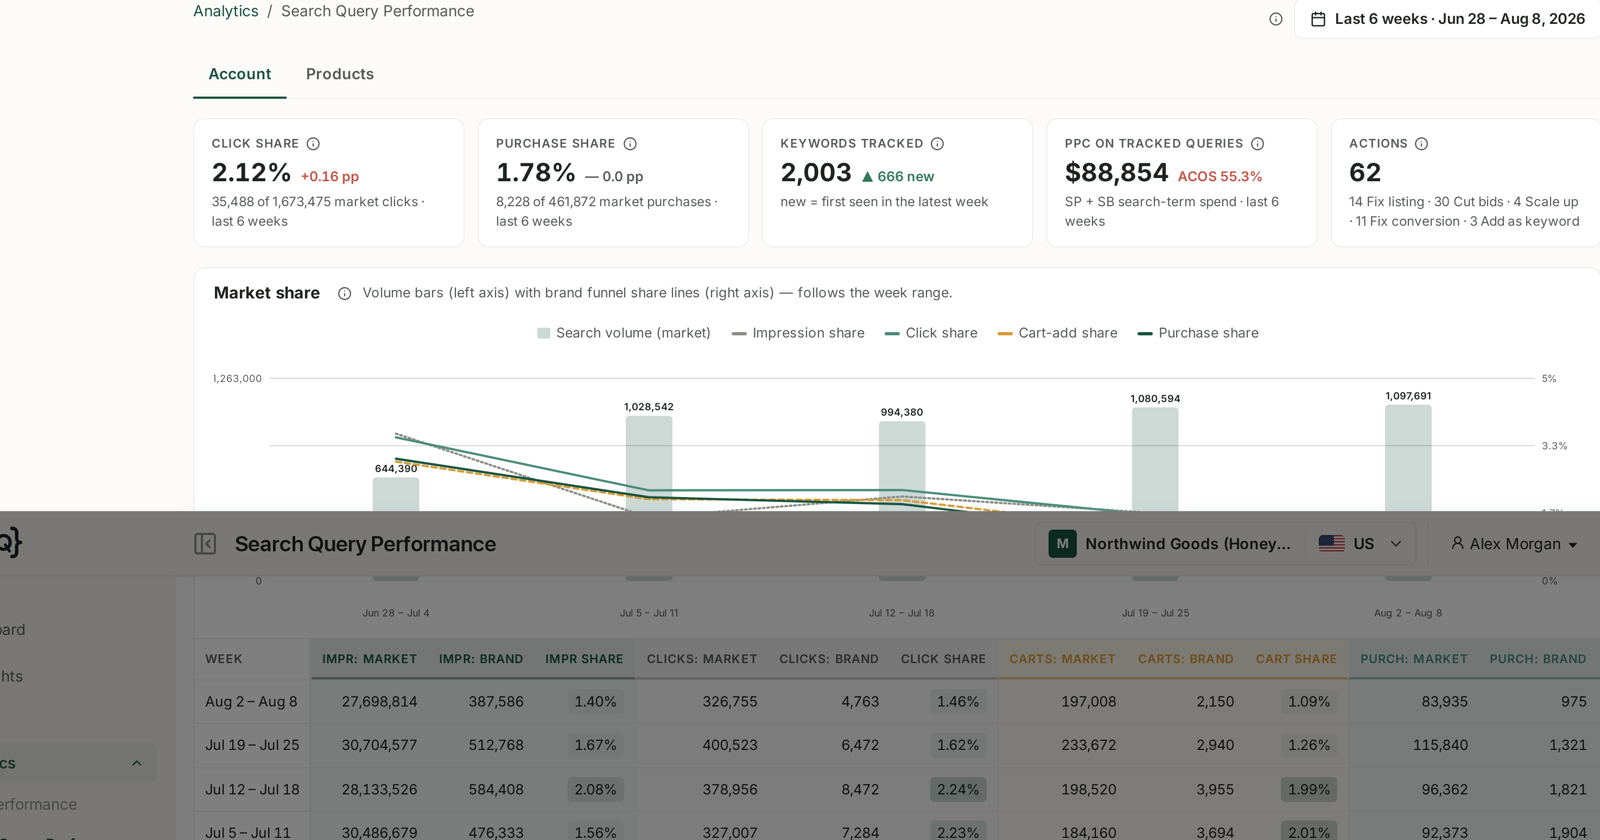
Two of the score's most important columns — search volume and its direction — are usually estimated from third-party tools. For markets adjacent to what you already sell, you can do better than an estimate.
Search Query Performance reports actual search volume per term and how much of it converts, which makes "is this market growing?" a data question rather than a guess. See Understanding Search Query Performance and SQP Is Weekly: Reading Week Cohorts for how to read the trend without misreading the cohorts.
Common mistakes
Looking for an absolute score. There isn't one.
Skipping the margin column because sourcing costs are unknown. Estimate it — a rough number beats a blank.
Ignoring FBA fees until after you have committed.
Treating the score as the decision rather than as a filter that decides where to spend the next fifteen hours.
Related
- Six Ways to Find Product Candidates — generating the list this ranks.
- Narrowing Fifteen Ideas to Seven — the deep pass on the survivors.
- Before You Add a Product — what a good market looks like.