

One card on the dashboard holds three different charts, switched by the tabs across its top. They are not three views of the same thing — each answers a different question, and knowing which is which saves you from reading the wrong one.
Prefer to watch? Seventy-four seconds on which tab answers which question.
Advertising Efficiency — is the advertising working?
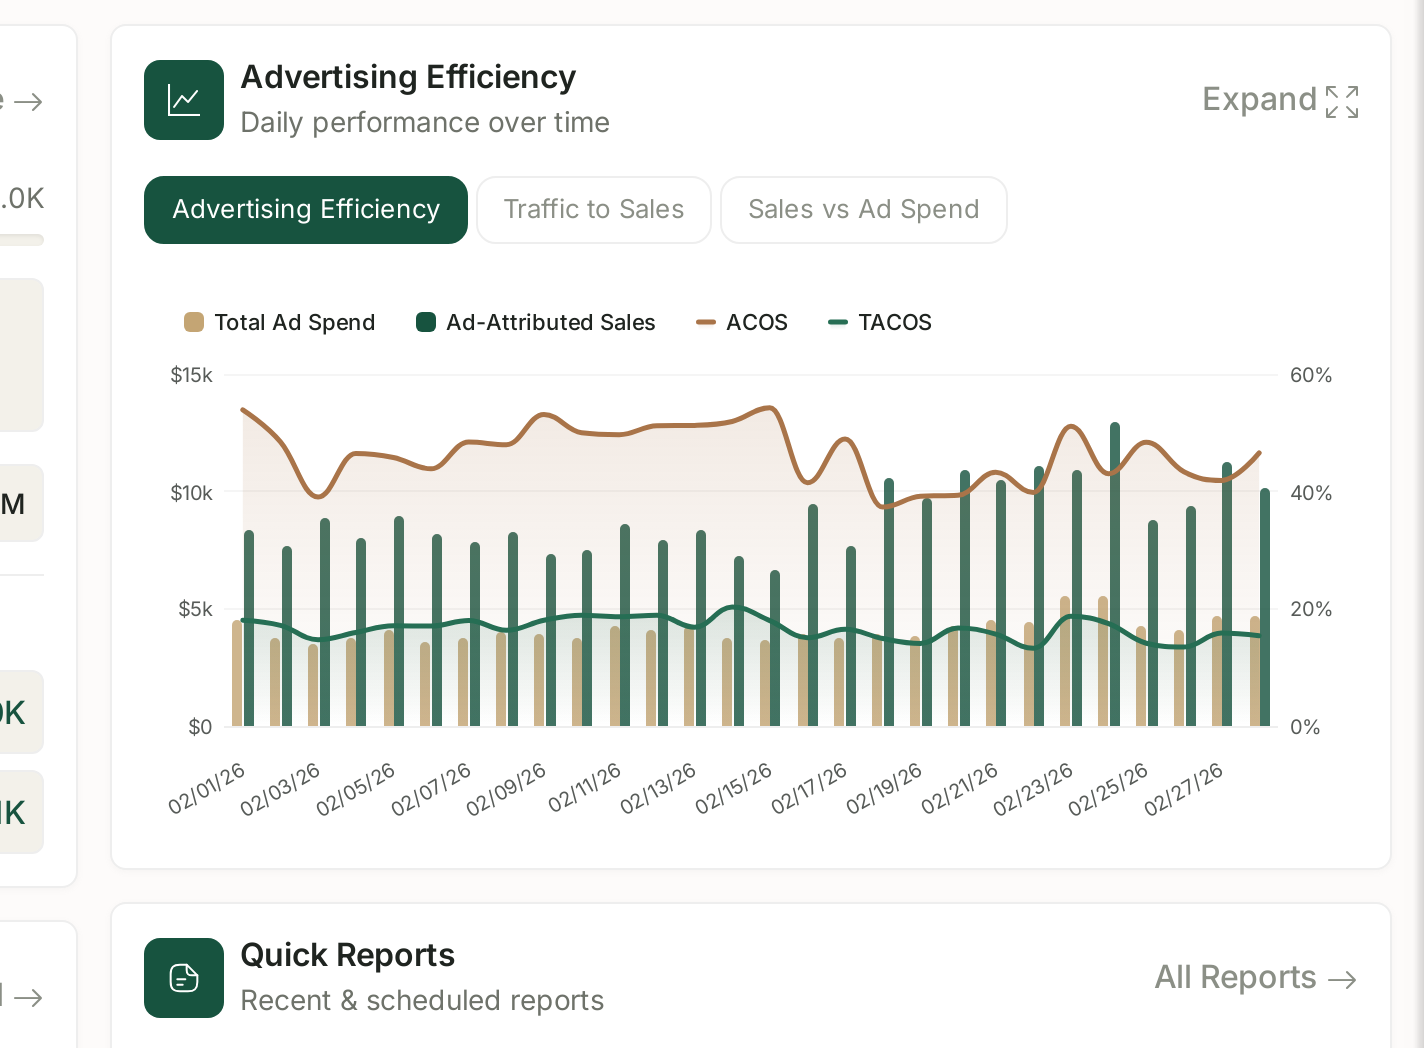
Four series on two axes. Bars are money on the left; lines are percentages on the right.
| Series | Shape | Read it for |
|---|---|---|
| Total Ad Spend | bar | what you put in |
| Ad-Attributed Sales | bar | what came back |
| ACOS | line | efficiency of the advertising |
| TACOS | line | dependence of the business on advertising |
Read the two lines against each other. That pairing is the whole point of this tab:
- ACoS steady, TACoS rising — advertising is working fine, but a larger share of your revenue now requires paying for it. Organic demand is eroding underneath a perfectly healthy campaign.
- ACoS rising, TACoS steady — an advertising problem, not a business problem.
- Both falling — the good case: efficient advertising on top of growing organic sales.
That first row is the one worth catching, and ACoS alone will never show it to you. See Understanding ROAS and Key Amazon Advertising Metrics.
Traffic to Sales — is the listing working?
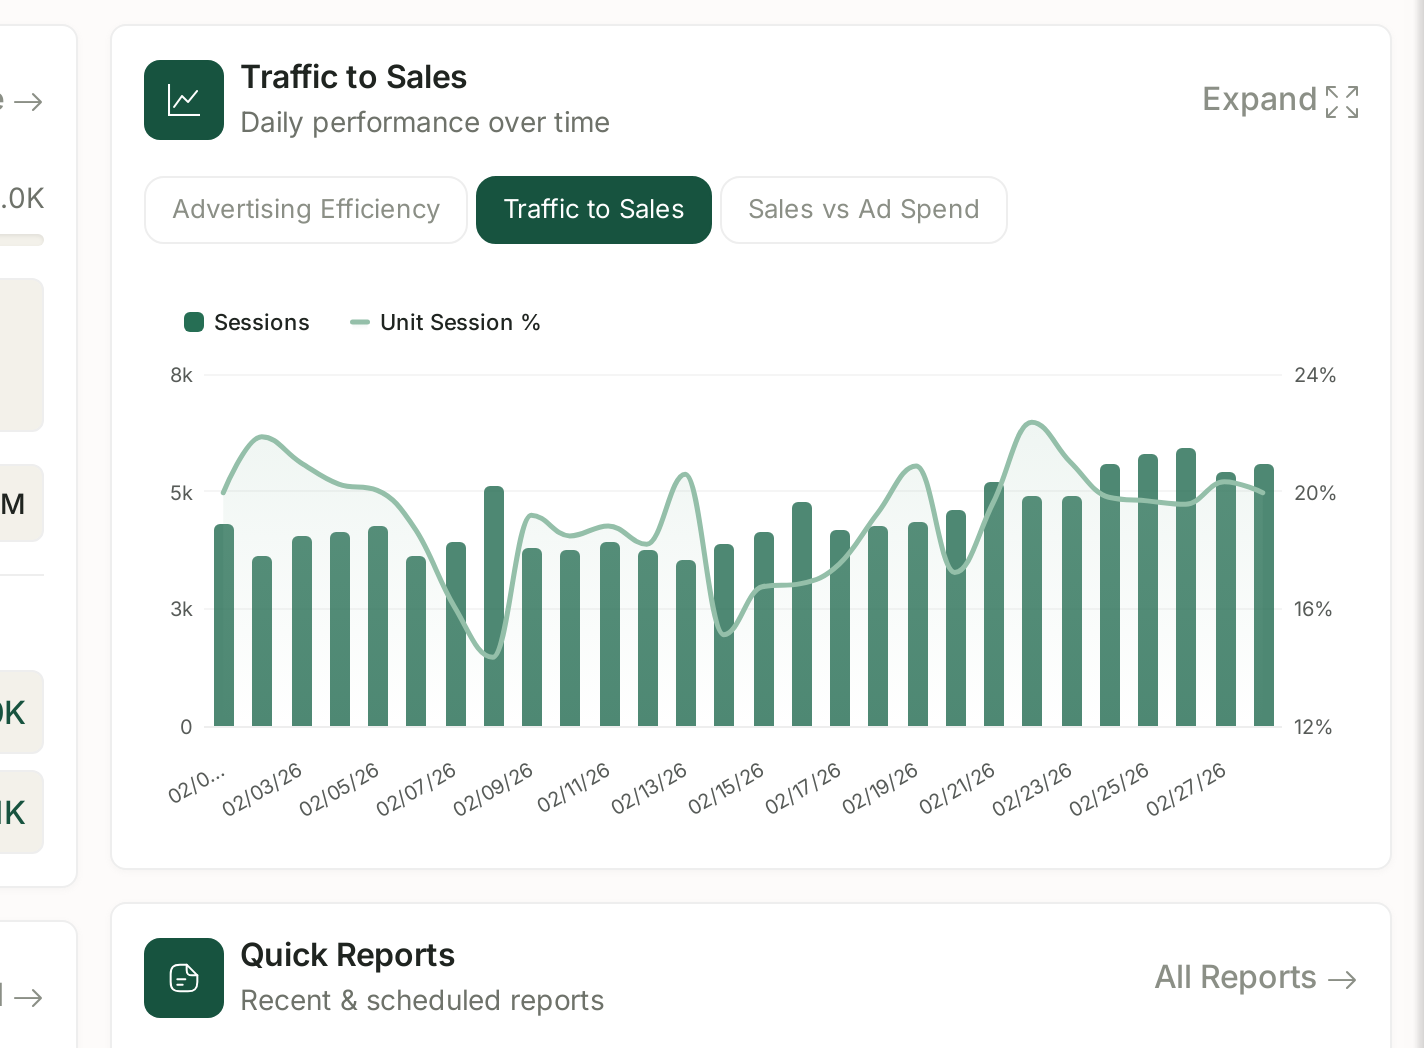
Two series. Sessions as bars, Unit Session % — your conversion rate — as a line.
This tab has nothing to do with advertising. It separates the two halves of a sales change:
| What moved | Where the problem is |
|---|---|
| Sessions fell, conversion flat | fewer people arriving — rank, visibility, or ad delivery |
| Sessions flat, conversion fell | the detail page — images, price, reviews, availability |
| Both fell | usually availability. Check stock first |
That last row is worth knowing: going out of stock takes conversion and traffic down together, because Amazon stops showing an unavailable product. See Inventory Forecasting.
Sessions rising while conversion falls is the classic sign of buying the wrong traffic — more visitors, less relevant. Worth checking your search terms.
Sales vs Ad Spend — how much of the business is paid?
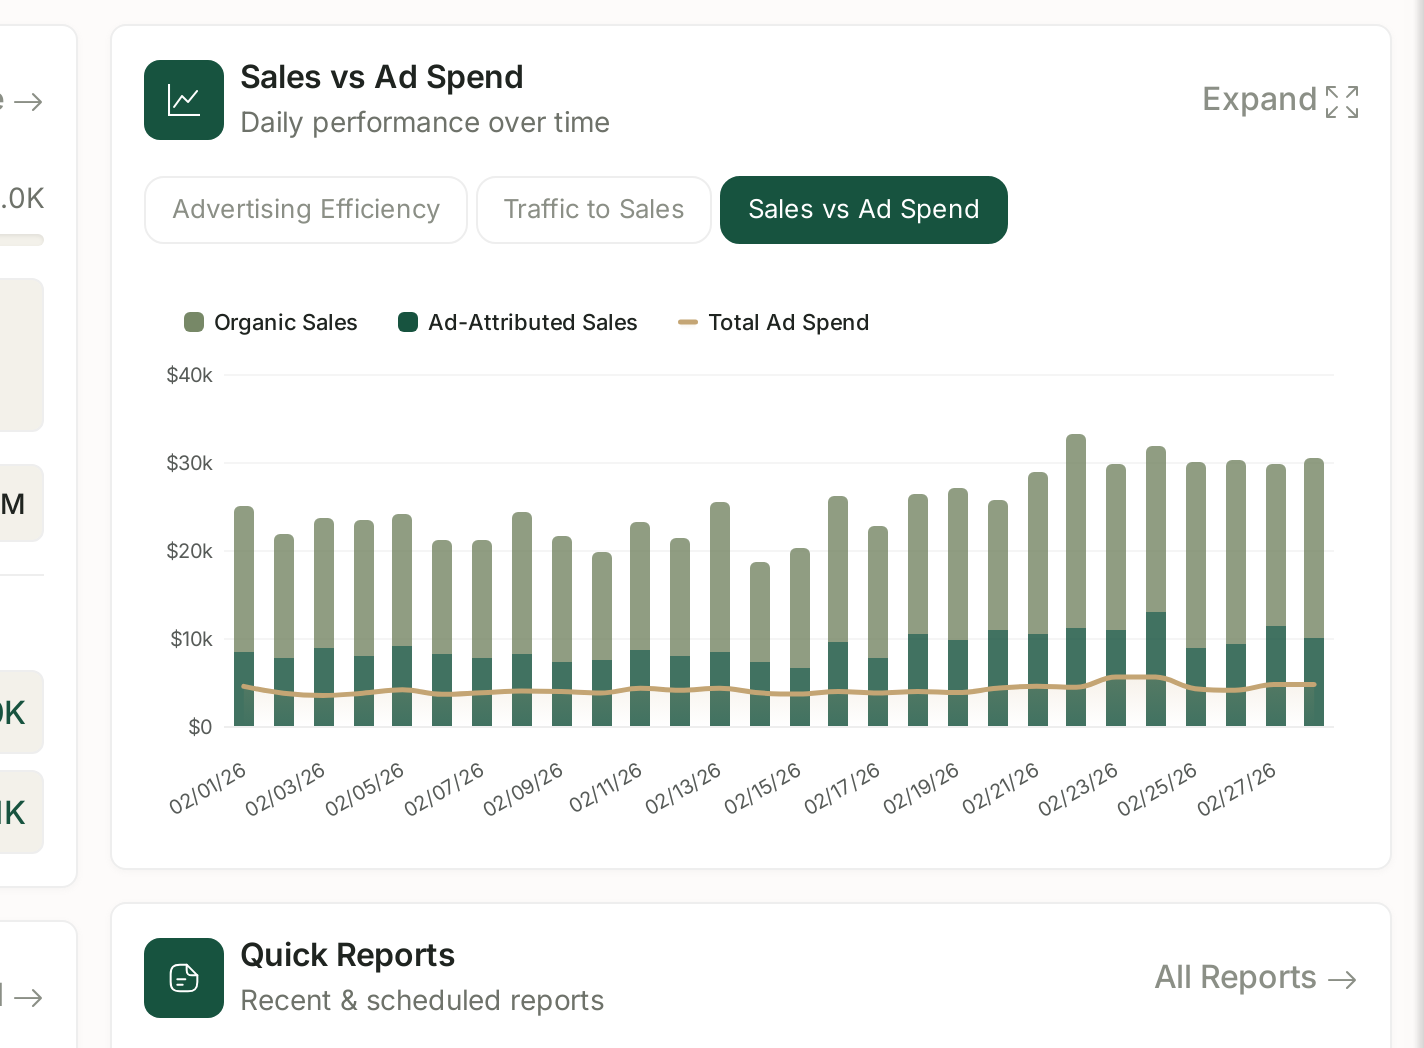
Three series: Organic Sales and Ad-Attributed Sales stacked as bars, with Total Ad Spend as a line across them.
Stacking is the point. The bar height is your total sales, and the split inside it is the mix. So this tab answers one question the other two cannot: how much of the business would still be there if you stopped advertising?
Watch the proportion rather than the heights. A stack that grows while the paid portion grows faster is a business becoming more dependent on advertising — the same story TACoS tells on the first tab, shown as volume rather than a ratio.
The spend line is there for shape, not scale. If it climbs while the bars do not, you are buying less with more.
Which tab for which question
| The question you actually have | Tab |
|---|---|
| Is my advertising efficient? | Advertising Efficiency |
| Am I getting more dependent on ads? | Advertising Efficiency (TACoS) |
| Why did sales drop? | Traffic to Sales |
| Is it traffic or the listing? | Traffic to Sales |
| How much of my revenue is organic? | Sales vs Ad Spend |
| Is spend keeping up with sales? | Sales vs Ad Spend |
Two things that apply to all three
Expand in the top-right of the card opens the chart larger. On a daily series across a month, that is usually the difference between seeing a trend and guessing at one.
The right-hand edge is always unreliable. Every one of these is a daily series, and the last day or two is still accruing — attribution windows have not closed and advertising data lands later than sales. A cliff at the right edge is reporting, not trading. Look again tomorrow before acting. See My Ad Data Is Missing or Looks Wrong.
Related
- Values vs % Change: The Comparison Toggle — reading the change correctly.
- Why Sponsored Products, Brands and Display Numbers Do Not Simply Add Up — before you total the series.