

ASIN Purchase Upsell finds the products your customers buy together, and pairs them up: a lead ASIN, an overlap ASIN, and the share of the lead's buyers who also bought the other one.
It is the raw material for two things — a bundle, and a remarketing campaign aimed at people who have already bought from you.
Prefer to watch? Eighty-three seconds on lead and overlap pairs, and why the denominator matters.
The headline numbers
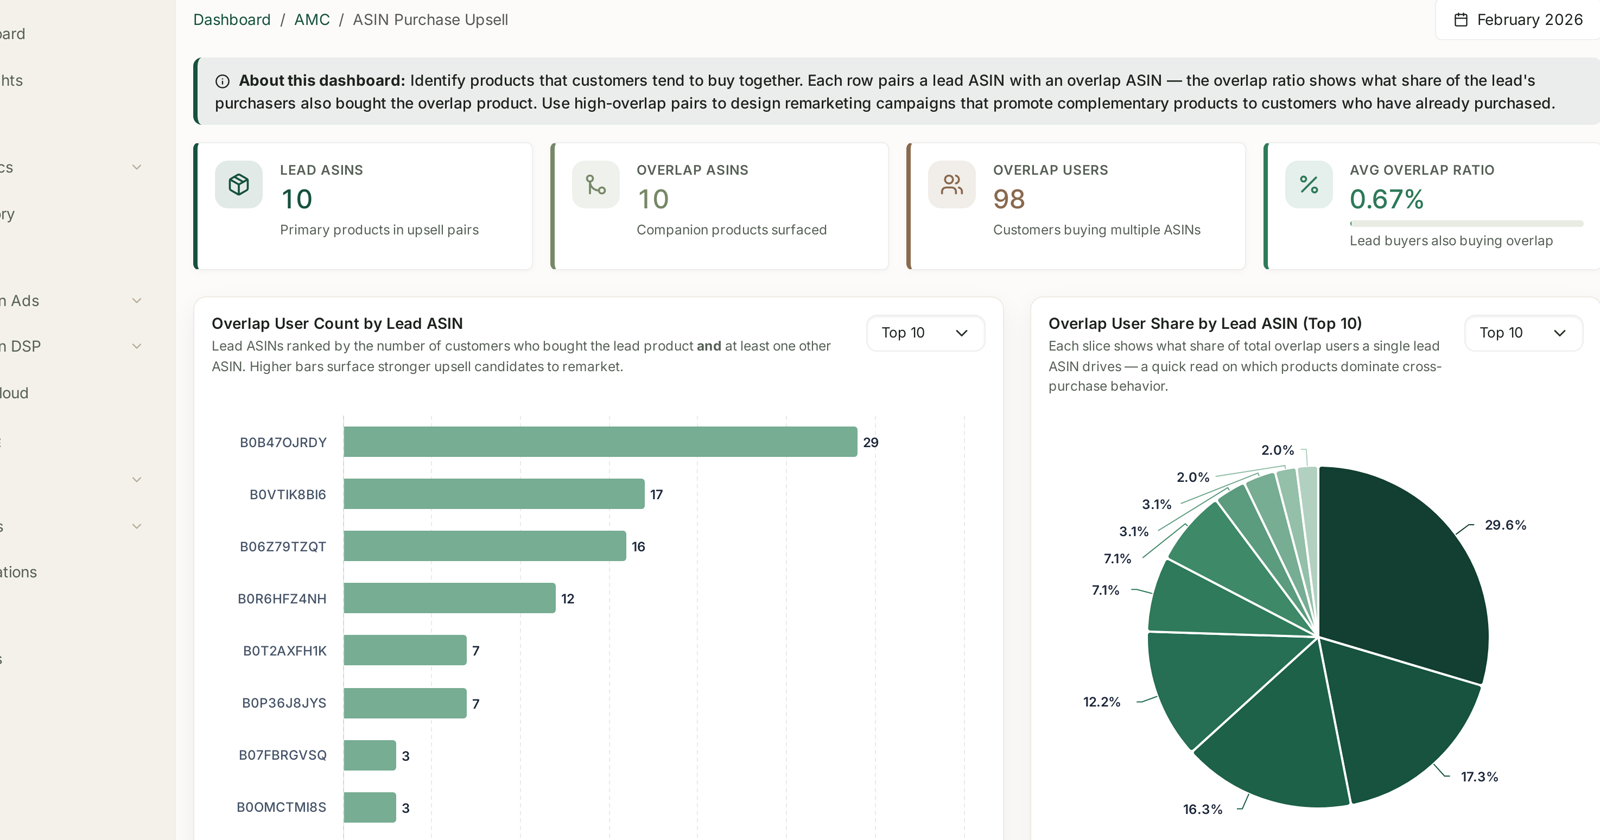
Identify products that customers tend to buy together. Each row pairs a lead ASIN with an overlap ASIN — the overlap ratio shows what share of the lead's purchasers also bought the overlap product.
| Tile | Reads |
|---|---|
| Lead ASINs | primary products in upsell pairs |
| Overlap ASINs | companion products surfaced |
| Overlap Users | customers buying multiple ASINs |
| Avg Overlap Ratio | share of lead buyers who also bought the overlap |
Read the base before the ratio
This is the dashboard where enthusiasm most needs a check, and the check is in the tiles above.
Cross-purchase is rare. An average overlap ratio under one percent, and overlap users in the double or low triple digits, is entirely normal — and it means every pair below is built on a handful of people. A ratio computed from three customers is not a finding. It is a hypothesis.
So read the two numbers together:
| Overlap users | Ratio | Reading |
|---|---|---|
| high | high | a genuine pair — act on it |
| high | low | a popular lead, weak companion pull |
| low | high | noise — a big percentage of very few people |
| low | low | nothing here |
The bottom-left row is the trap, because a high ratio is exactly what catches the eye.
The two charts
Overlap User Count by Lead ASIN ranks lead products by how many customers bought them and at least one other ASIN. Higher bars surface stronger upsell candidates to remarket.
Overlap User Share by Lead ASIN shows what share of all cross-purchase behaviour each lead product accounts for — which products dominate cross-purchase behaviour.
Both are counts, not rates, which is why they are the right place to start. Find the products with real cross-purchase volume first, then look at their ratios.
The pair table
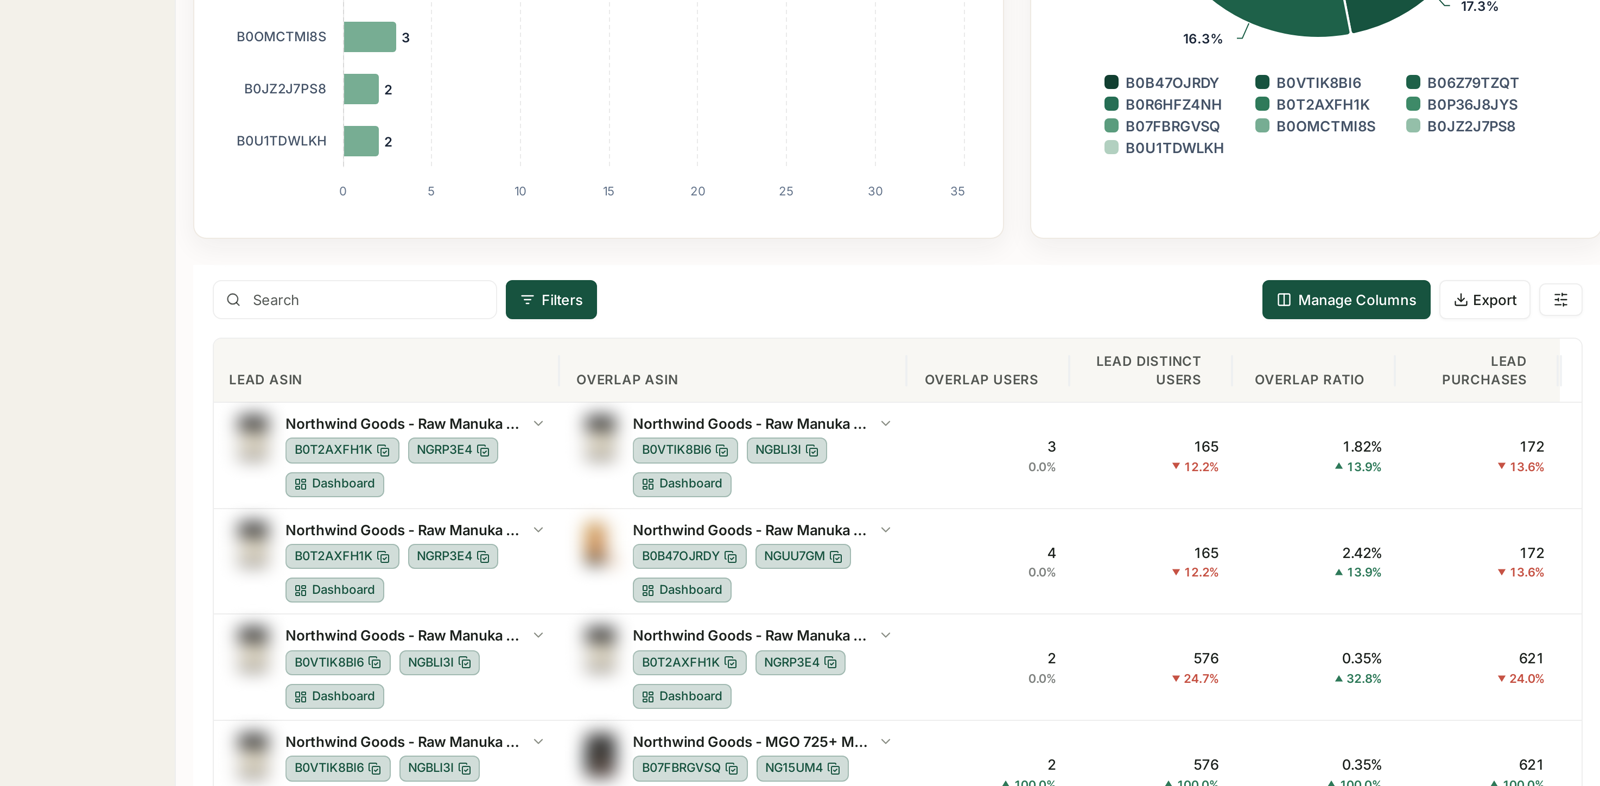
Every pair is listed with both products — image, title, ASIN, SKU and a Dashboard chip each — plus:
Overlap Users · Lead Distinct Users · Overlap Ratio · Lead Purchases, each with a change against the previous month.
The arithmetic is straightforward and worth confirming as you read: overlap ratio = overlap users ÷ lead distinct users. Three overlap users against 165 lead buyers is 1.82%.
Seeing the denominator beside the ratio is the point of the table. The charts give you candidates; this tells you how much to trust each one.
What to do with a good pair
Build a remarketing audience. The clearest use, and the one the dashboard suggests: customers who bought the lead product but not the overlap are the audience. That is a DSP remarketing campaign with an unusually specific creative brief. See DSP Campaigns.
Test a bundle. If the pair is genuinely popular, a listed bundle removes a step for the customer. Test it before committing inventory — a high overlap ratio says people buy both, not that they want them in one box.
Check the sequence. A pair tells you that both were bought, not in which order. If one is consistently the entry product, it belongs in your gateway list — see NTB ASINs Analysis.
Sanity-check against the catalog. Some pairs are obvious (a product and its refill) and some are surprising. The surprising ones are where the value is, provided the base is large enough to believe.
What not to conclude
Overlap is not causation. Both purchases may follow the same need rather than one leading to the other.
Pairs are not ordered. Lead and overlap are labels for the row, not a claim about sequence.
This is ad-attributed behaviour, so purely organic cross-purchase is not represented.
Small numbers move violently. A pair going from 2 to 4 customers is a 100% increase and means almost nothing. Watch the change column with that in mind.
Monthly cohorts. One calendar month at a time.
Related
- NTB ASINs Analysis: Finding Your Gateway Products — which product starts the relationship.
- DSP Campaigns — where a remarketing audience gets built.
- Find your next bundle from what customers already buy together — the playbook.
- Why AMC Data Is Monthly and Sometimes Empty — the reporting cadence.
- Six Ways to Find Product Candidates — using cross-purchase data as a research method.