

Amazon DSP puts your products in front of people who were not searching for them. That single difference changes how it should be judged — and judging display on ROAS alone will make a campaign that is doing its job look like one that is failing.
Prefer to watch? Sixty-six seconds on reading the conversion funnel.
Why ROAS is the wrong first question
Sponsored Products meets demand that already exists: someone searches, you appear, they buy, and the sale is credited to the click.
DSP mostly creates demand. Someone sees your product, does not buy, and comes back three days later through a search — where a different campaign gets the credit. Read only the last column and you will conclude display does not work.
The funnel is how you see the part that does.
The conversion funnel
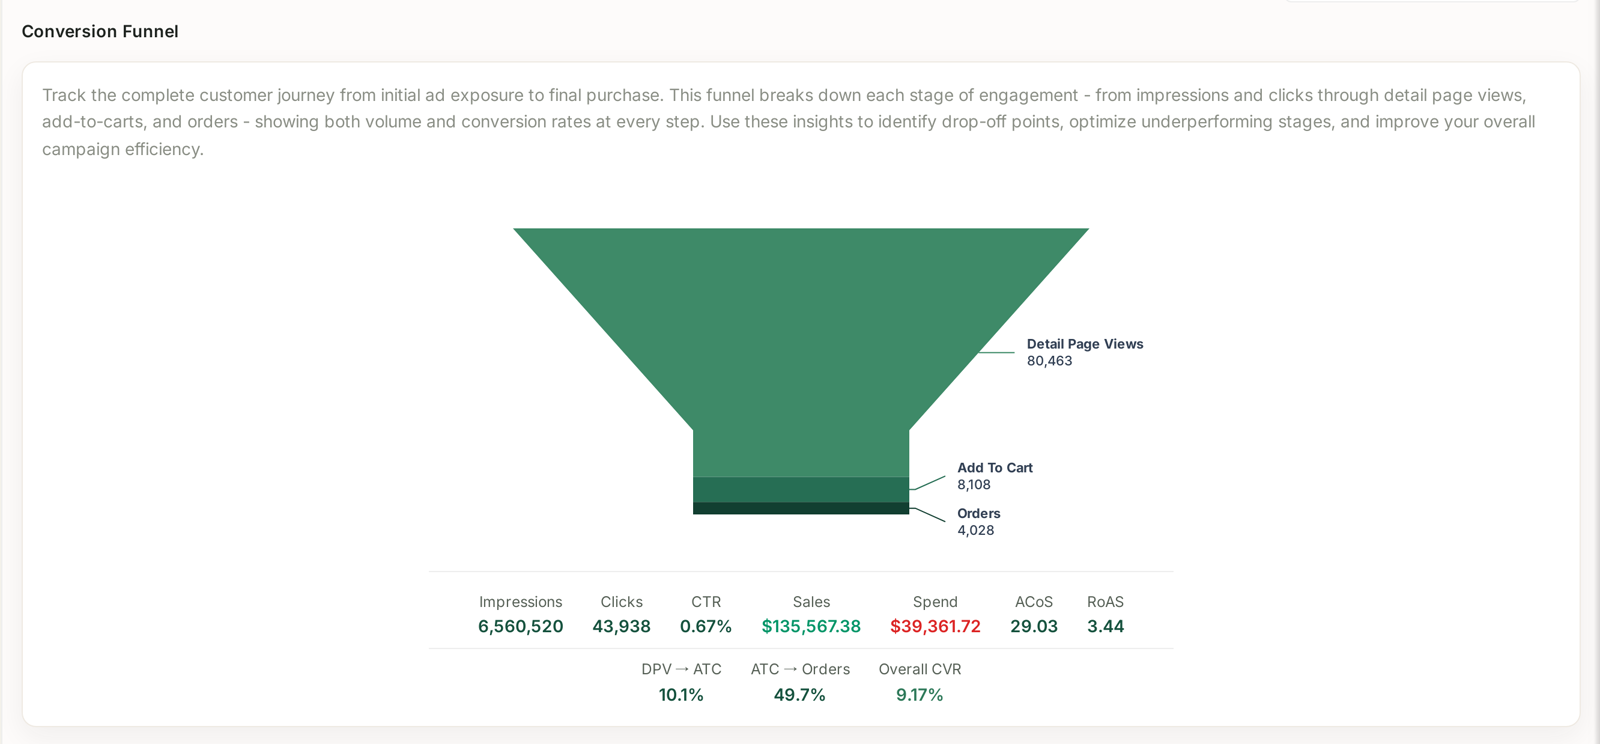
The funnel traces the whole journey: impressions → clicks → detail page views → add to cart → orders, with the volume at each stage.

Underneath sit the numbers that actually diagnose a campaign:
| Ratio | Answers |
|---|---|
| DPV → ATC | of the people who looked at the product, how many wanted it? |
| ATC → Orders | of the people who wanted it, how many bought? |
| Overall CVR | end to end |
Alongside them, the headline figures: impressions, clicks, CTR, sales, spend, ACoS and ROAS.
Reading the funnel across
This is the skill worth learning. Each stage that leaks points at a different fix:
| Where it drops | What it means | What to change |
|---|---|---|
| Impressions → few clicks | the creative is not earning attention | creative, audience |
| Clicks → few detail page views | wrong people, or a mismatch between ad and product | targeting |
| DPV → few add to carts | they looked and were not convinced | the listing — images, price, reviews |
| ATC → few orders | they wanted it and stopped | price, shipping, availability |
Notice that two of the four are listing problems, not campaign problems. That is the most common misdiagnosis in display advertising: pausing a campaign that was delivering the right people to a page that could not close them.
The campaign table
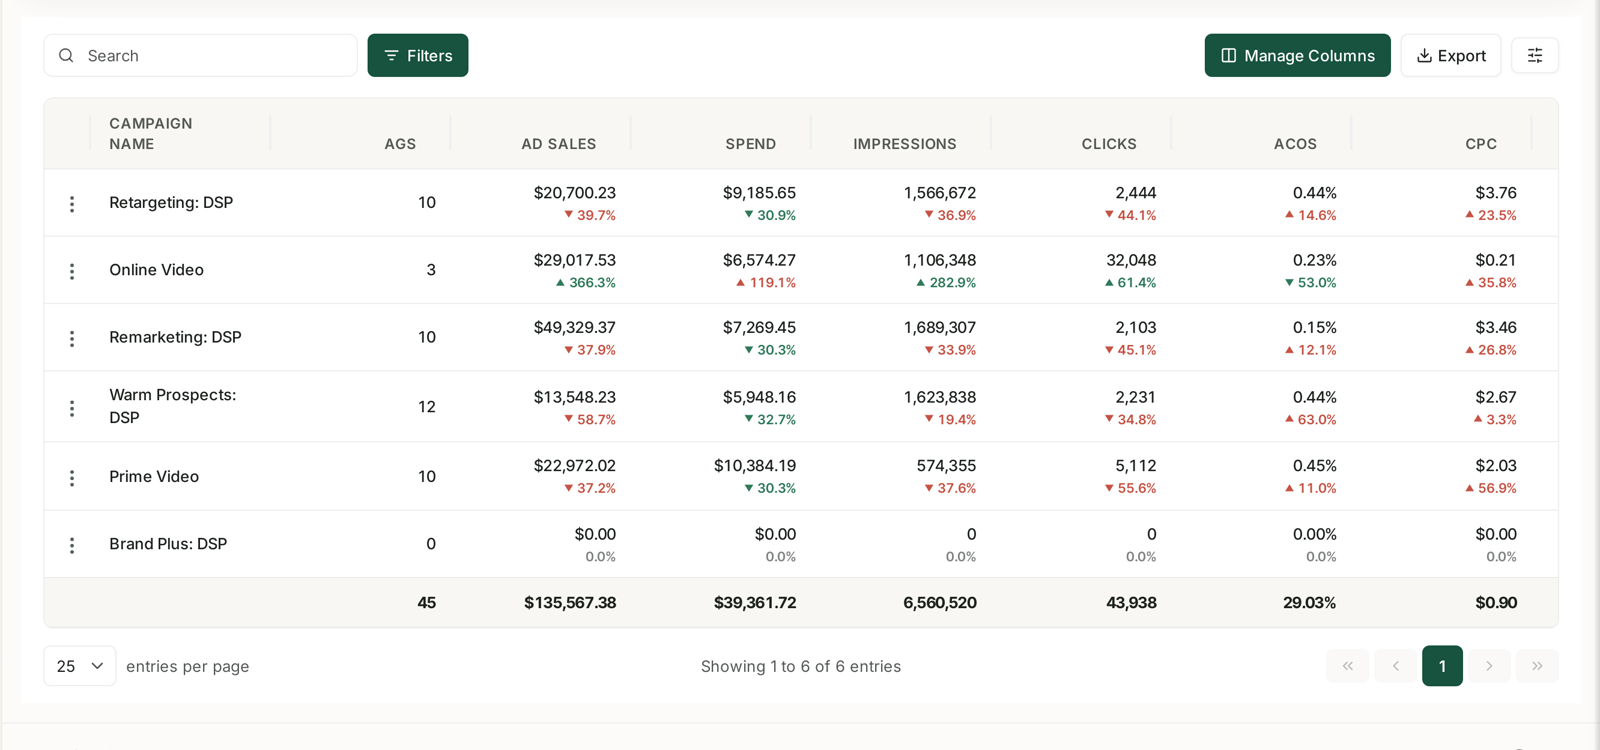
Below the funnel, the same logic per campaign. Alongside the familiar Ad Sales, Spend, Impressions, Clicks, ACoS and CPC, DSP carries columns you will not see on the Sponsored Ads screens:
| Column | What it counts |
|---|---|
| DPV | detail page views driven by the ad |
| Add to Cart | cart additions driven by the ad |
| NTB Purchase Clicks | clicks that ended in a purchase by a shopper new to your brand |
| NTB Purchases | purchases by shoppers new to your brand |
| CPA | cost per acquisition |
| CVR | conversion rate — the Sponsored Ads screens call this CR |
New-to-brand is the number that justifies the channel. If DSP is doing the job it exists for, its NTB share should beat what your Sponsored Products campaigns manage. That is the case for running it: it buys customers rather than orders.
The other seven DSP screens
Each applies the same columns to a different dimension, so you can find where performance is concentrated:
| Screen | Groups by |
|---|---|
| Ad Groups | ad group |
| Creatives | individual creative |
| Audience | audience segment |
| Products | product |
| Technology | device |
| Geography | location |
| Inventory | where the ad ran |
Creatives and Audience are the two worth checking first when the funnel shows a problem at the top. A weak click rate is usually one creative or one segment dragging the average, not the campaign as a whole.
Where to start
Open the funnel, find the stage with the sharpest drop, and fix that stage. Then use the campaign table to see whether the problem is everywhere or concentrated in one or two campaigns.
To compare DSP's new-customer performance against your other channels, the AMC Cloud dashboards break new-to-brand down across all of them at once.
Related
- DSP Campaigns — the campaign layer, line by line.
- DSP Ad Groups — where audience, supply and device are actually set.
- DSP Creatives — which creative is carrying the campaign.
- DSP Products — performance by promoted ASIN.
- DSP Technology: Device and Supply Performance — device and supply-source performance.
- DSP Geography — where the impressions landed.
- DSP Metrics Explained: DPV, Add to Cart, NTB Purchases and CPA — DPV, Add to Cart, NTB Purchases and CPA.
- Decide Whether Your Upper-Funnel DSP Is Worth Keeping — the playbook for deciding.