

Two scores appear beside every query on the SQP Analysis table, they are colour-coded, and neither is explained anywhere obvious. They are worth understanding, because between them they answer "where should I look first?" faster than any column of raw numbers.
Prefer to watch? Seventy-nine seconds on a rank, a market-calibrated grade, and the grid they make together.
Where they appear
Search Query Performance → SQP Analysis.
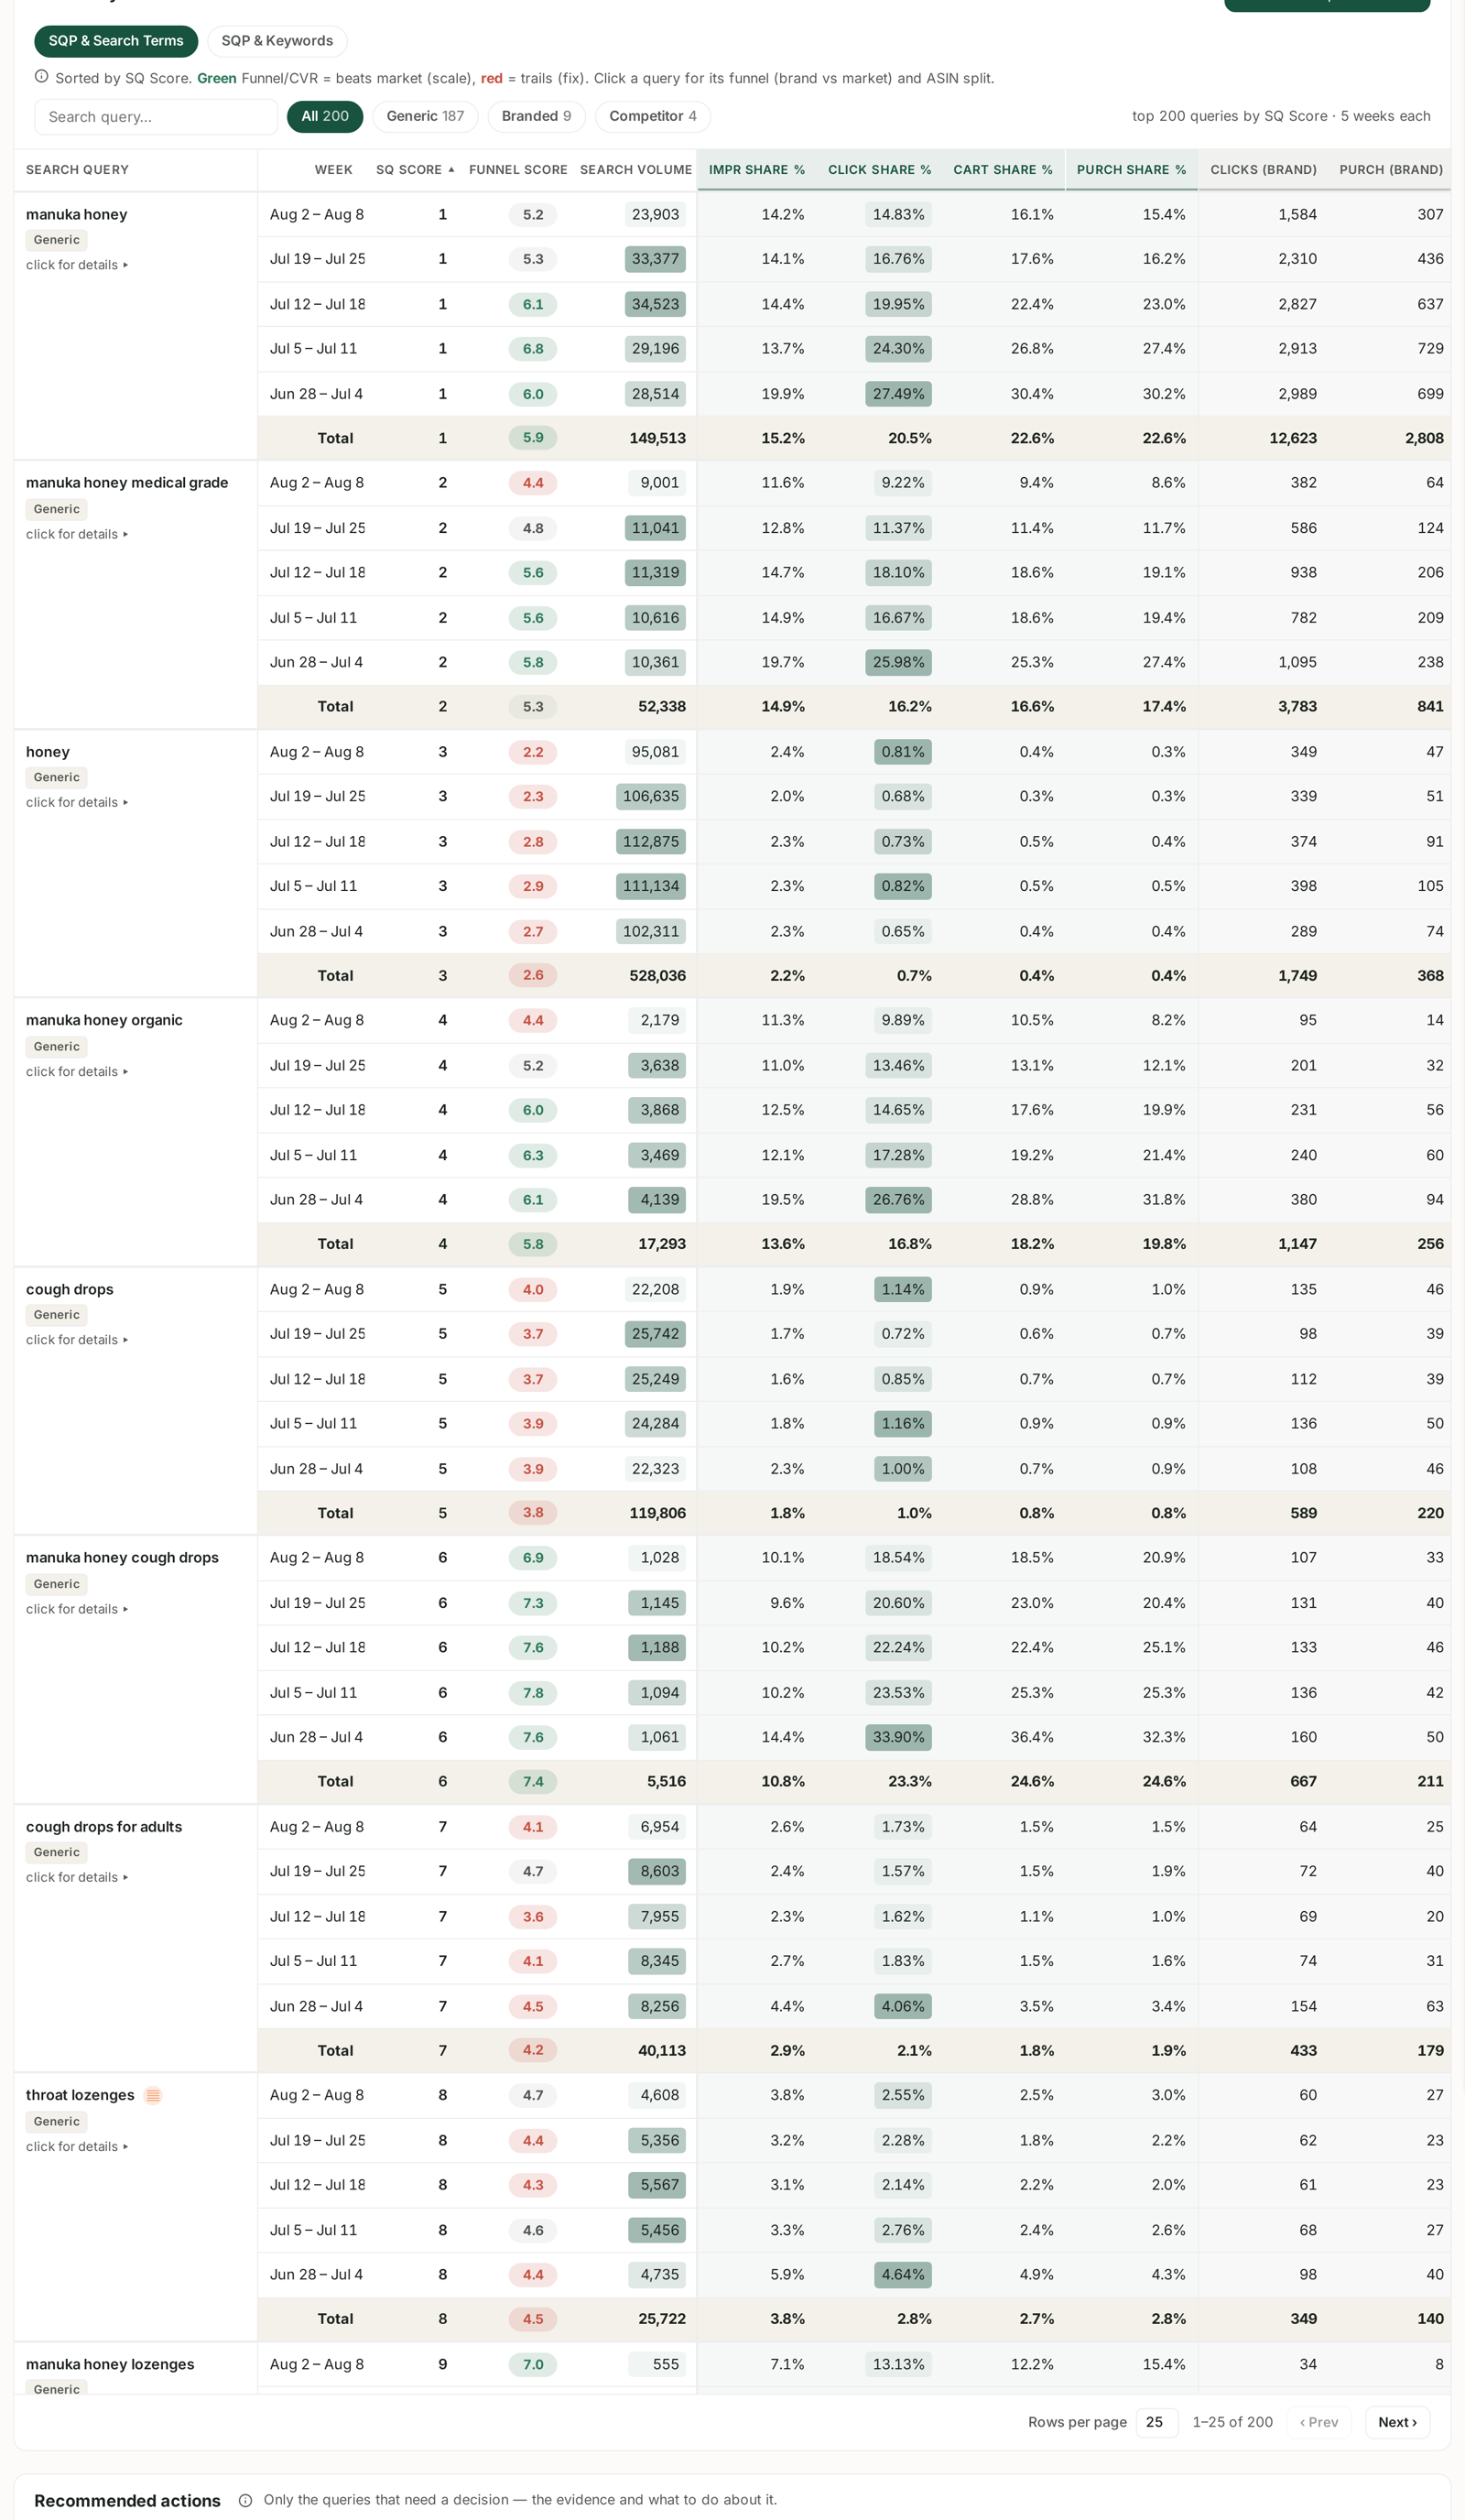
The note above the table sets out the convention:
Sorted by SQ Score. Green Funnel/CVR = beats market (scale), red = trails (fix). Click a query for its funnel (brand vs market) and ASIN split.
That single line contains most of what you need. The colour tells you what to do; the score tells you how much.
SQ Score — the priority rank
SQ Score is a rank, and 1 is top.
It orders your queries by how much they matter to you, so the table opens with the query most worth your attention rather than the one with the biggest search volume. That distinction matters: the highest-volume term in your category may be one you have no realistic chance on, while a mid-volume term you already convert well on is where the next hour is best spent.
Read it as a queue, not a grade. SQ Score 1 does not mean "excellent"; it means "start here". The table shows the top 200 queries by SQ Score, five weeks each.
Funnel Score — how you convert, against the market
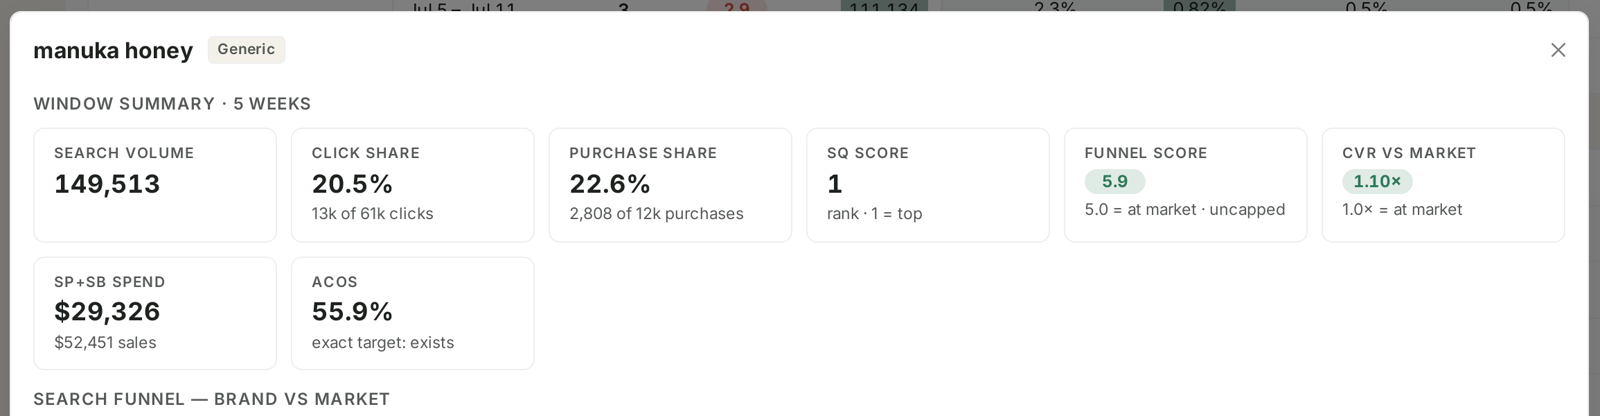
Funnel Score is calibrated so that 5.0 is at market, and it is uncapped.
This is the part that makes it useful. Most scores in most tools are graded against a target somebody invented. This one is graded against what every other seller on that query actually achieves.
| Funnel Score | Means |
|---|---|
| above 5.0 | you move shoppers through the funnel better than the market |
| 5.0 | exactly average for this query |
| below 5.0 | the market converts this query better than you do |
Uncapped matters too: a score of 9 is genuinely twice as far above market as a 7, so the differences between strong queries stay visible instead of everything bunching at the top of a 1–10 scale.
CVR vs Market — the same idea, as a multiple
Beside it sits CVR vs Market, where 1.0× is at market. A query at 1.10× converts ten percent better than the average seller on that search.
Funnel Score covers the whole journey — impressions through to purchase. CVR vs Market is just the final step. When they disagree, that is informative: a strong funnel score with a weak CVR multiple means you win the click and lose the checkout.
Reading the colours
The colour coding is a two-word instruction:
Green — scale. You beat the market on this query. The constraint is visibility, not quality, so bidding up and improving rank will buy more of something that already works.
Red — fix. The market converts this better than you. Bidding up buys more of a problem. Open the funnel and find the stage that breaks. See Search Query Cart Analysis: Why a Query Doesn't Convert.
That is the whole decision, and it is the opposite of what most people do with an underperforming term, which is spend more on it.
Using the two together
The scores are most useful as a grid rather than individually:
| SQ Score | Funnel Score | What it is | Do |
|---|---|---|---|
| high priority | green | a proven winner you under-serve | scale — bid, rank, harvest it |
| high priority | red | an important query you are losing | fix — listing work, then revisit |
| low priority | green | works, but small | leave it; note it for later |
| low priority | red | not worth the effort | ignore, or negative-match |
The top-left cell is where money is. A query already near the front of your queue that you convert better than anybody else on, and are not shown enough for, is the cheapest growth available — and it is exactly the case where raising a bid is the right move.
What not to conclude
Green does not mean profitable. It means you convert better than the market. A query can beat the market and still cost more per sale than your margin allows — check ACoS beside it.
A low SQ Score is not a bad query. It is a lower priority for you, given your products and performance.
The market includes everybody. All sellers on that query, not just your real competitors. On a broad term that pool is wide.
Five-week window. Both scores are computed across the window, not for a single week. SQP reports weekly cohorts — see SQP Is Weekly: Reading Week Cohorts Correctly.
Related
- Search Query Cart Analysis: Why a Query Doesn't Convert — what to do when a score is red.
- The SQP Dashboard: Market Share, Analysis and Recommended Actions — the screen these sit on.
- Recommended Actions: The Queries That Need a Decision — the same judgement, pre-sorted by money.
- Generic, Branded and Competitor Terms — the chips that filter the table.