

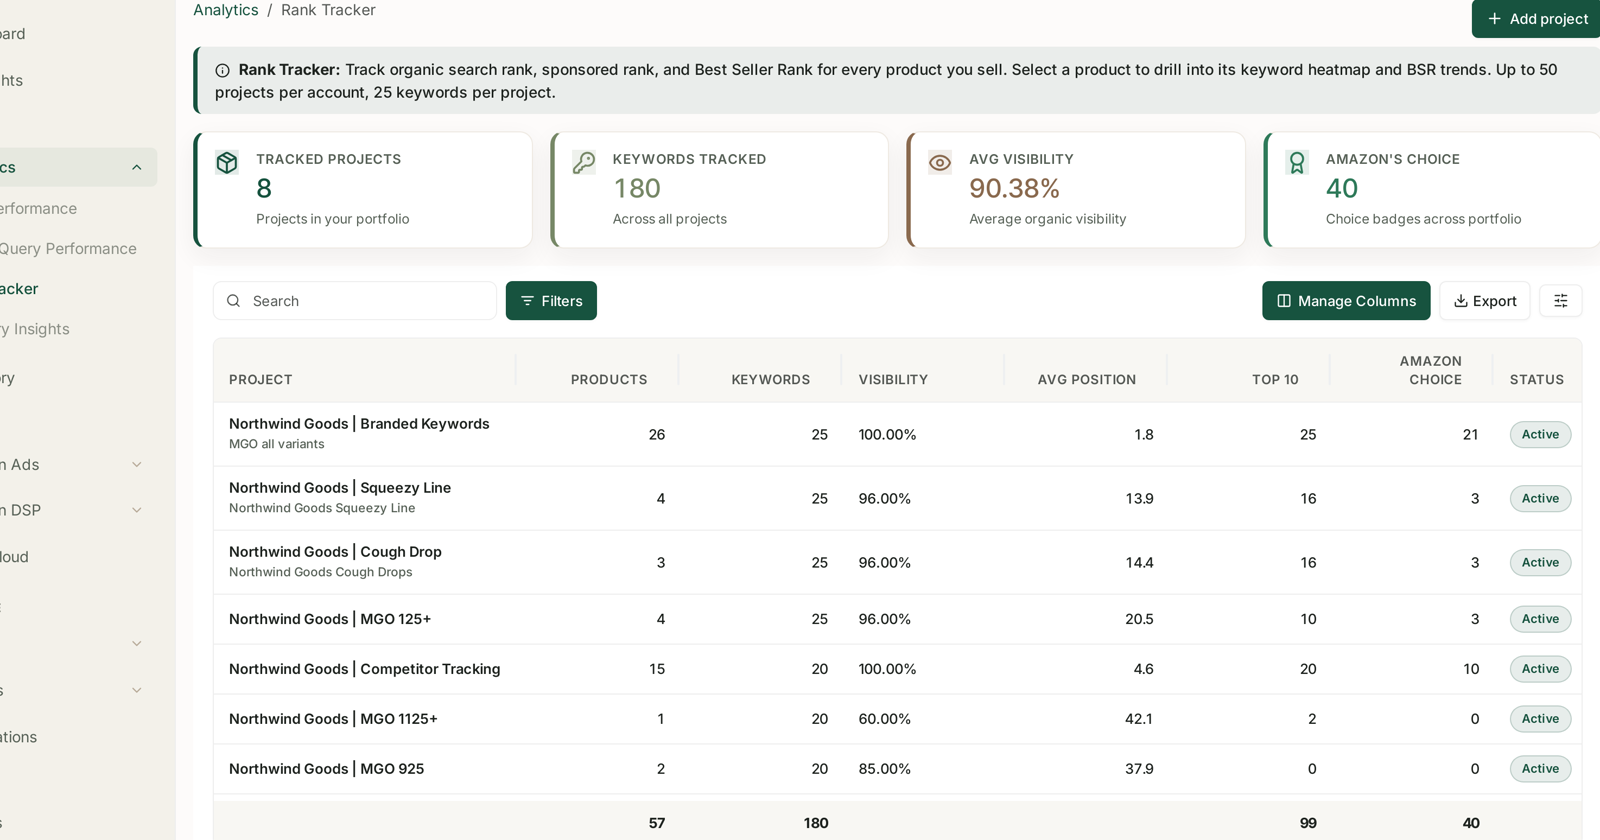
Rank Tracker reports the same four measures at three levels — portfolio, project, product — and they mean the same thing at each. Learning them once is most of learning the screen.
The one to be careful with is Visibility, because it is an average of averages, and averages hide the thing you most want to find.
Prefer to watch? Seventy-nine seconds on the four columns, and the zero that drags a project down.
The four measures
| Measure | What it is | Direction |
|---|---|---|
| Visibility | share of voice across the keywords you track | higher is better |
| Avg Position | mean organic rank across those keywords | lower is better |
| Top 10 | how many tracked keywords rank in the first ten | higher is better |
| Amazon's Choice | badges held across the set | higher is better |
Two of the four move in opposite directions, which is the single most common misreading of this screen. A project whose Avg Position went from 14.4 to 20.5 got worse. See Tracking the Amazon's Choice Badge for the fourth.
Visibility averages upward
A product's visibility is its share of voice across the keywords tracked for it. A project's visibility is the plain mean of its products'. The portfolio figure is the plain mean of the projects'.
That is worth stating plainly, because it means a single dead product silently drags a project down:
| Product | Visibility |
|---|---|
| MGO 80+ Squeezy | 76.00% |
| Raw Manuka Honey MGO 30+ | 96.00% |
| Manuka Honey Squeezy MGO 182+ | 68.00% |
| MGO 80+ Squeezy (second listing) | 0.00% |
| Project | 60.00% |
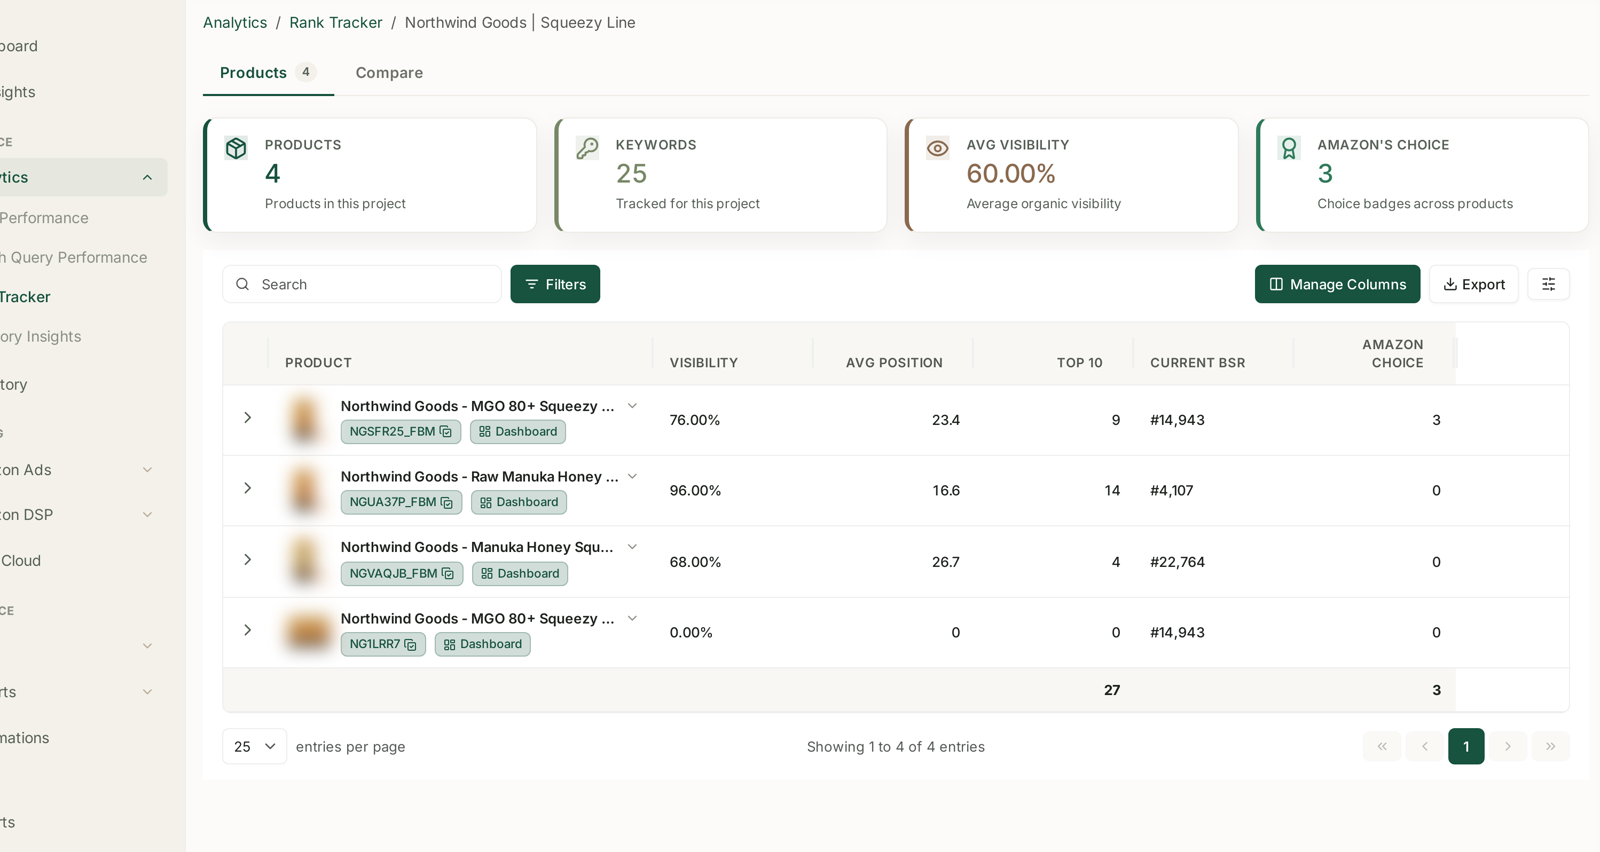
The project reads 60% and looks mediocre. It is actually three healthy listings and one that returns nothing — a duplicate listing, a suppressed ASIN, or a product that simply does not rank for these terms.
So always open the project before believing its headline. A number in the sixties is either "everything is middling" or "most things are fine and one is broken", and those need completely different responses. A 0.00% row is covered in Rank Data Shows Blank.
Avg Position is a mean, so it hides its own shape
Avg Position tells you the centre. It does not tell you whether you have a tight cluster around #16 or two clusters at #4 and #40 — and those are different businesses.
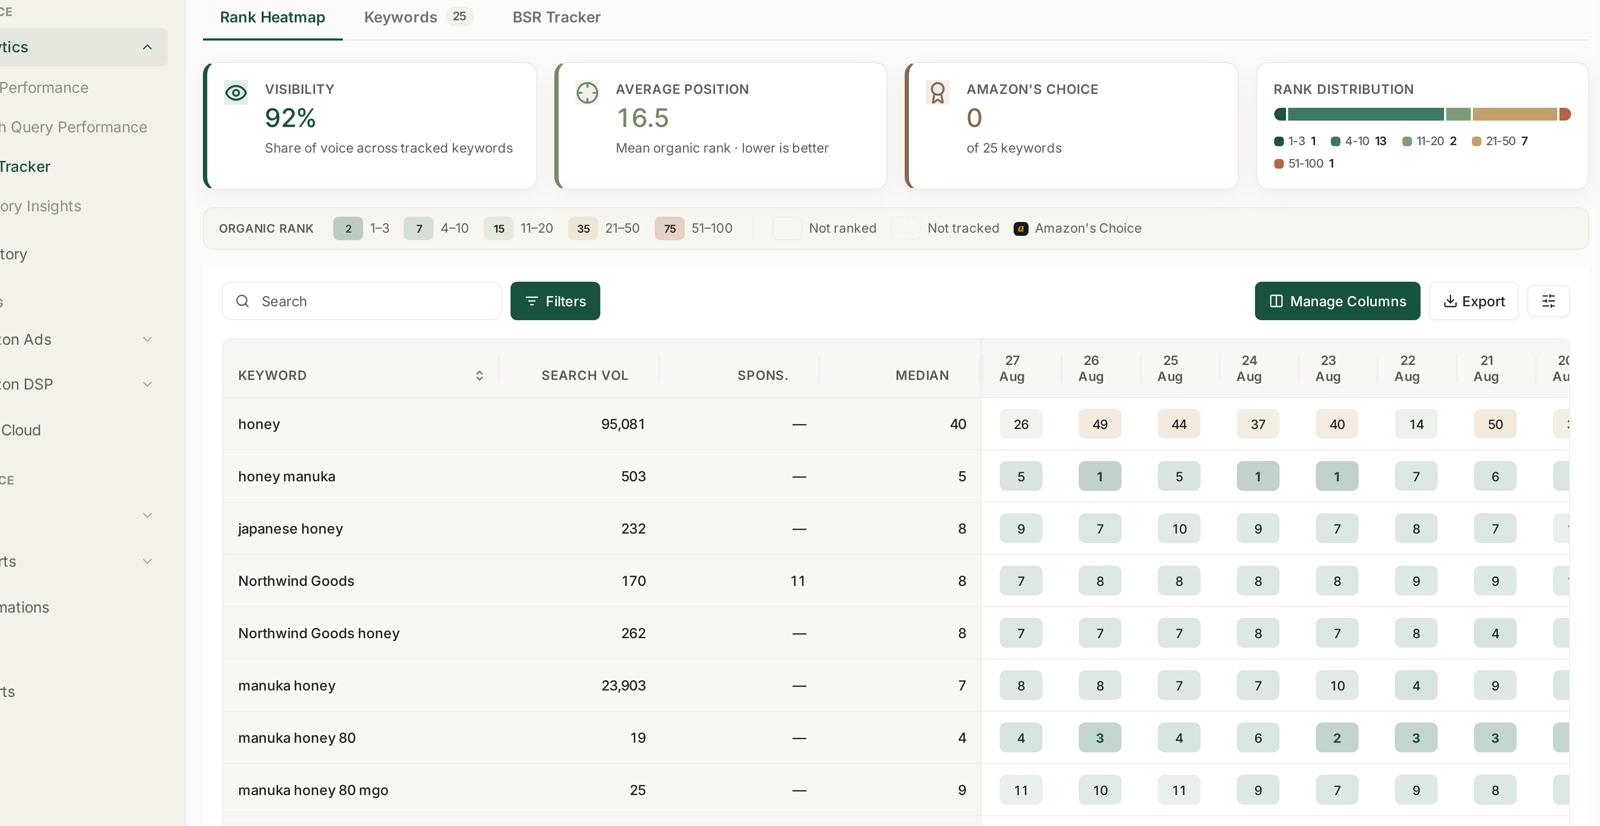
The product view solves this directly with Rank Distribution, a stacked bar splitting the tracked keywords into the standard bands:
1–3 · 4–10 · 11–20 · 21–50 · 51–100
An average of 16.5 that is mostly 4–10 with a tail at 21–50 is a strong product with a few terms it should stop chasing. The same 16.5 spread evenly across every band is a product with no clear position at all. Read the distribution first, then the average.
Top 10 is the honest one
Top 10 is a count, so it cannot be dragged by outliers. Nobody argues about whether a keyword is in the first ten.
Use it as the check on the other two. A project whose Avg Position improved while Top 10 stayed flat did not win anything that matters — it moved terms from #60 to #40, which changes the mean and changes no customer's behaviour.
Moving a keyword from #11 to #9 is worth more than moving five keywords from #60 to #40. Top 10 is the column that says so.
Keywords Covered, on the Compare tab
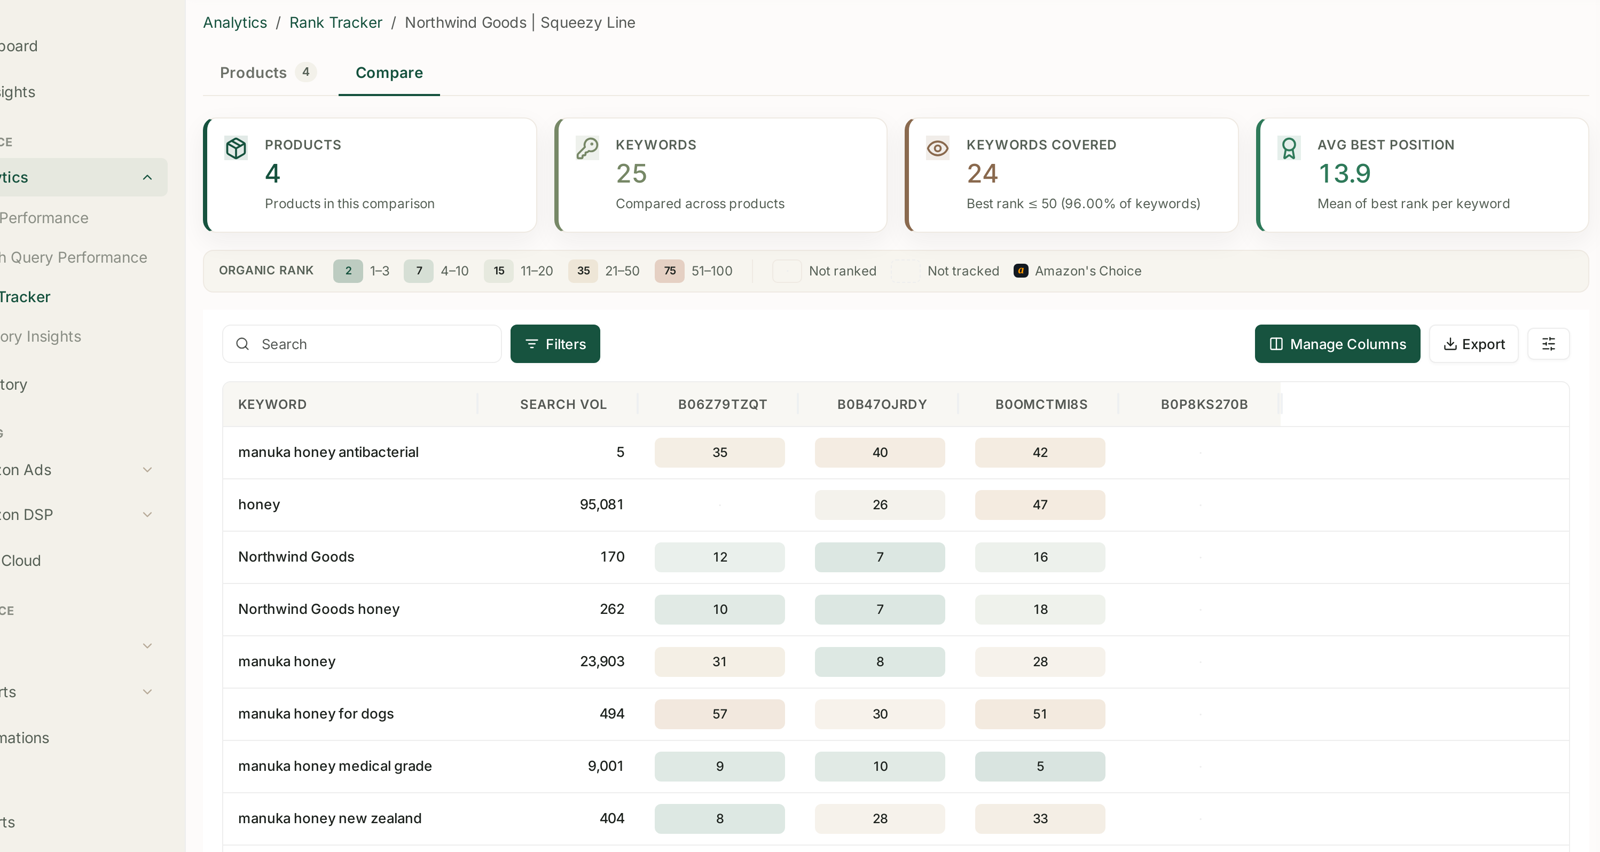
The Compare tab swaps in two measures that answer a different question — not "how is this product doing" but "does the project cover its keywords at all":
- Keywords Covered — how many keywords have at least one product ranking in the top 50, shown as a count and a percentage.
- Avg Best Position — the mean of the best rank per keyword, across every product in the project.
These are catalog-level questions. Keywords Covered at 96% means one product or another shows up for nearly every term; the gap is the term nothing you sell ranks for. Avg Best Position of 1.8 on a branded project means your own name reliably returns you first.
Reading the three levels in order
Portfolio — which project moved? Sort by Visibility, then check Avg Position moved the same way.
Project — is it every product, or one? Look for a row far from its siblings.
Product — which keywords? Open the Rank Heatmap and read the columns right to left.
Three clicks, narrowing each time. Doing it in the other order — starting from a keyword you have a hunch about — is how you spend an afternoon confirming something that was never the problem.
What not to conclude
Visibility is not traffic. It is a rank-derived measure across the keywords you chose. Adding twenty-five easy terms will raise it without selling a single extra unit.
Averages across different intents are meaningless. A project mixing branded terms with broad category terms produces an Avg Position that describes neither.
A single day is noise. Amazon search results are personalised and volatile. The heatmap exists because the trend is the signal.
Related
- Rank Tracker: Creating Your First Project — how the keyword set gets chosen.
- Rank Data Shows Blank — the 0.00% rows.
- Best Seller Rank Tracking — the rank that is not a search rank.
- Organic vs Sponsored Rank — the second position on every keyword.