

Every ad-attributed purchase is either from somebody new to your brand or somebody buying again. NTB Purchases splits them, campaign type by campaign type, so you can see which formats are actually recruiting and which are collecting orders you were probably going to get anyway.
Prefer to watch? Eighty-two seconds on the per-ASIN definition, and why DSP sits at the bottom.
The definition here is narrower than you think
Read the panel at the top carefully, because it does not say what its sister dashboards say:
Purchases are considered new-to-brand (NTB) if a customer purchased a specific ASIN for the first time during the previous 365-day period on Amazon.
That is per ASIN, not per brand. NTB Customers and NTB ASINs Analysis both define NTB at brand level. This dashboard counts a first purchase of that product.
The practical consequence: a loyal customer buying a different product of yours for the first time counts as an NTB purchase here, and does not count as an NTB customer there. That is why the two dashboards' NTB shares differ — 52.52% against 55.21% on the same account, same month. They are not meant to match, and reconciling them is wasted effort.
| Dashboard | NTB means | Counts |
|---|---|---|
| NTB Purchases | first purchase of this ASIN | orders |
| NTB Customers | first purchase from your brand | people |
| NTB ASINs | first purchase from your brand | people, per product |
The headline numbers
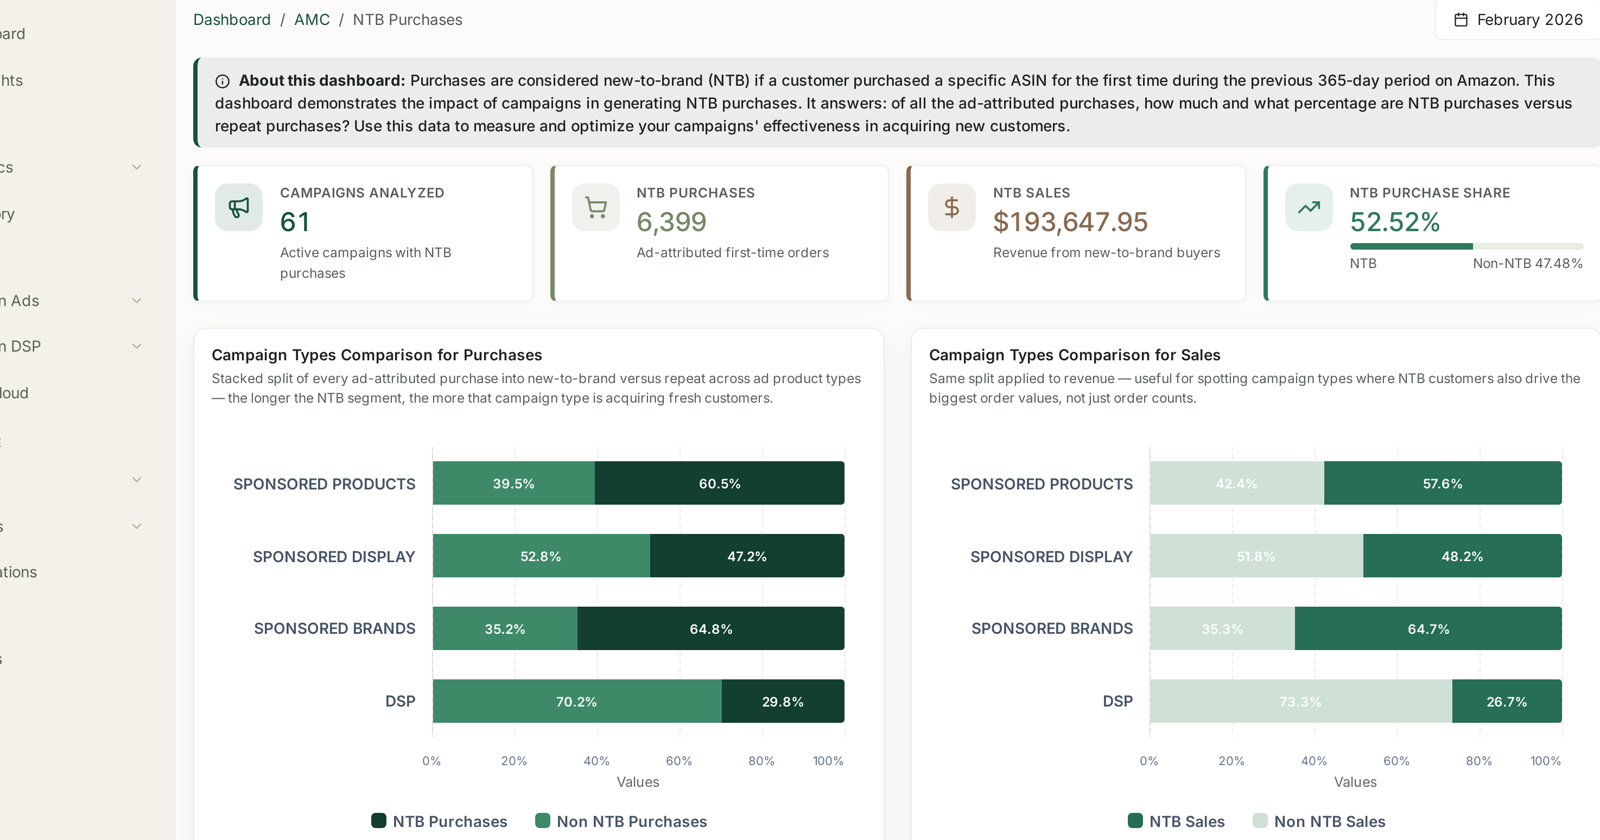
| Tile | Reads |
|---|---|
| Campaigns Analyzed | active campaigns with NTB purchases |
| NTB Purchases | ad-attributed first-time orders |
| NTB Sales | revenue from new-to-brand buyers |
| NTB Purchase Share | NTB as a percentage, non-NTB beside it |
Campaign Types Comparison
Two stacked charts sit side by side — the same split applied to purchases and then to sales:
Stacked split of every ad-attributed purchase into new-to-brand versus repeat across ad product types — the longer the NTB segment, the more that campaign type is acquiring fresh customers.
Same split applied to revenue — useful for spotting campaign types where NTB customers also drive the biggest order values, not just order counts.
On this dashboard the NTB segment is the darker one, on the right. That is the opposite colour convention from NTB Customers, and the opposite side from NTB ASINs. Check the legend every time.
Reading the split across formats
A representative month looks like this:
| Ad type | NTB share of purchases |
|---|---|
| Sponsored Brands | 64.8% |
| Sponsored Products | 60.5% |
| Sponsored Display | 47.2% |
| DSP | 29.8% |
The result that surprises people is DSP at the bottom. Display is supposed to be the upper funnel — and it is, when it is bought that way. A DSP setup weighted toward remarketing and retargeting audiences reaches people who have already visited your pages, and those people are mostly not new to the brand.
That is not a failing of DSP. It is a description of which audiences you bought. The check is on DSP Campaigns: if remarketing and retargeting dominate the campaign list, a low NTB share is exactly what that spend was purchased to produce, and the honest question is whether the prospecting side is funded at all.
Sponsored Brands at the top is the mirror image. It runs on broader, more discovery-shaped queries, so it recruits — usually on modest volume.
Down to individual campaigns
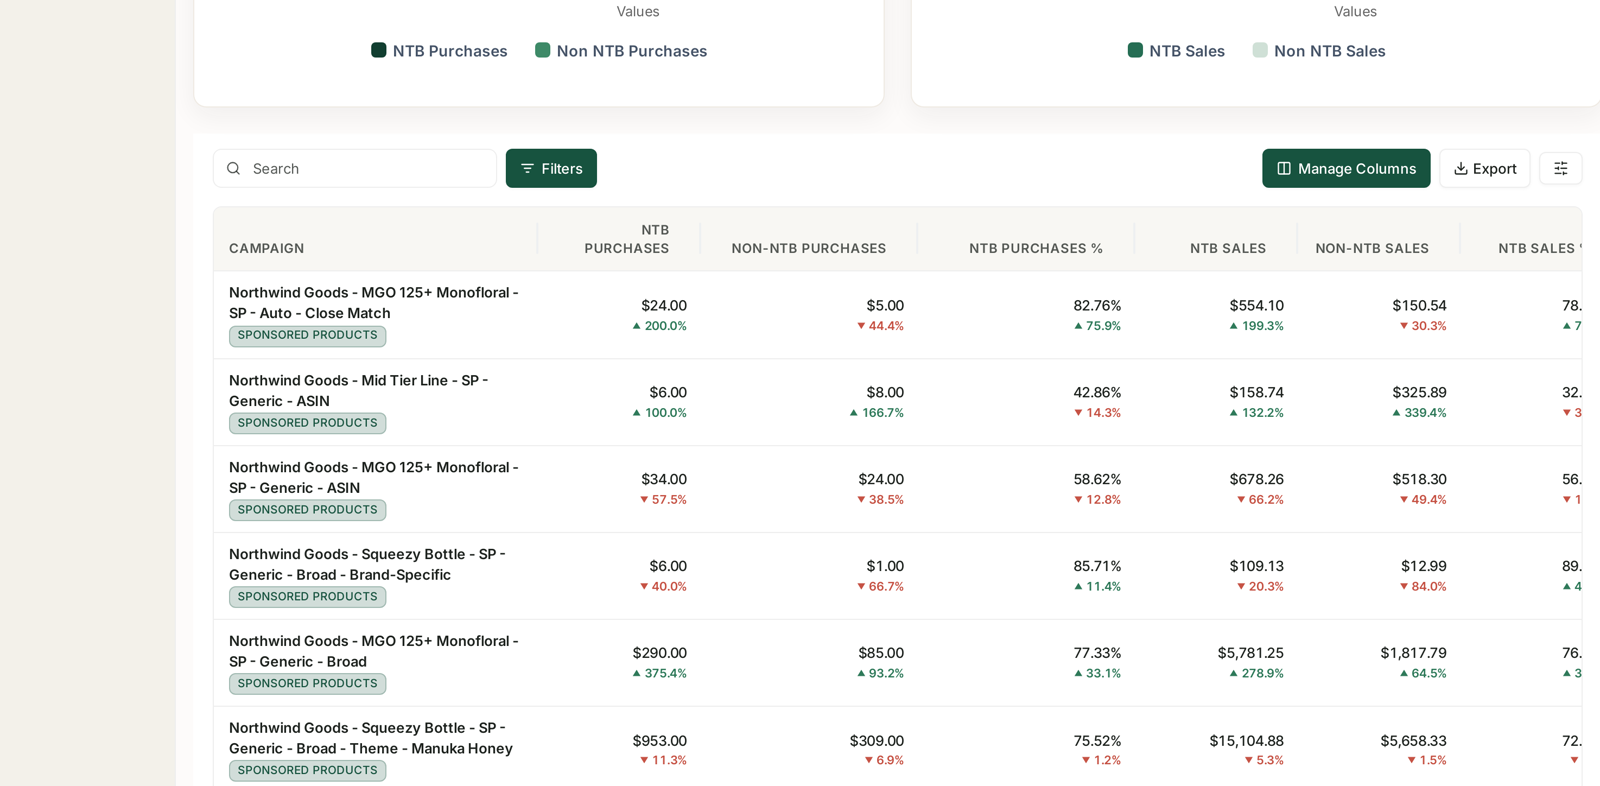
The chart groups by ad product type; the table beneath it goes campaign by campaign, with the NTB and non-NTB split of both purchases and sales, the percentage beside each, and a change against the previous month.
That is the level at which you can act. "Sponsored Products is 60% new-to-brand" is context; "this generic broad campaign is 85% new-to-brand and this brand-specific one is 42%" is a budget decision — and it is exactly the split you would expect, since brand-specific terms reach people who already know the name.
Compare the two charts, not just one
The purchases chart and the sales chart rarely agree, and the gap is the useful part:
NTB share higher in sales than purchases means your new customers spend more per order than your repeat ones — often a sign the format is recruiting into a premium or bundle product.
NTB share lower in sales than purchases means new customers buy the cheap entry item, which is normal and healthy if the second order is bigger.
A format strong on both is the one to fund. It brings new people and they spend.
What to do with it
Judge prospecting formats on NTB, not ACoS. A campaign type with 65% NTB and a poor ACoS may be your cheapest source of customers. Judging it on efficiency alone guarantees you cut it. See Understanding ROAS and Key Amazon Advertising Metrics.
Set a floor for acquisition. If NTB purchase share across the account drifts down month over month while total sales hold, you are gradually converting your advertising into a remarketing programme. That looks efficient right up until growth stops.
Cross-check against Path to Purchase. If DSP shows low NTB here, the path data usually shows why — DSP appearing late in journeys rather than first. See Path to Purchase: Which Ad Sequences Actually Convert.
What not to conclude
NTB does not mean incremental. It means the buyer had not bought that ASIN in a year. The ad may or may not have caused it.
Do not compare the share to NTB Customers. Different definitions, as above.
A single month is a cohort, not a trend. Seasonality moves NTB share hard — gifting periods inflate it, replenishment periods depress it.
Related
- NTB Customers: New vs Repeat, Counted as People — the same idea counted differently.
- NTB ASINs Analysis: Finding Your Gateway Products — which products recruit.
- What 'New to Brand' Actually Means — the definition in full.
- DSP Campaigns — checking what your display spend actually bought.