

NTB Customers counts people, not orders. That single difference is what makes it the most useful of the three new-to-brand dashboards, because a customer is the thing you actually acquire — orders are just what they do afterwards.
Prefer to watch? Seventy-eight seconds on counting people, and the budget trap in the two charts.
The definition
A customer is considered new-to-brand (NTB) the first time they purchase from your brand in the previous 365 days. This view breaks the ad-attributed audience into NTB versus repeat purchasers per campaign and ad product type.
Brand-level and person-level. Somebody who buys four times this month is one customer here, and four purchases on NTB Purchases. That is why the two dashboards report different shares on identical data, and why neither is wrong. See NTB Purchases: New Business by Campaign.
The headline numbers
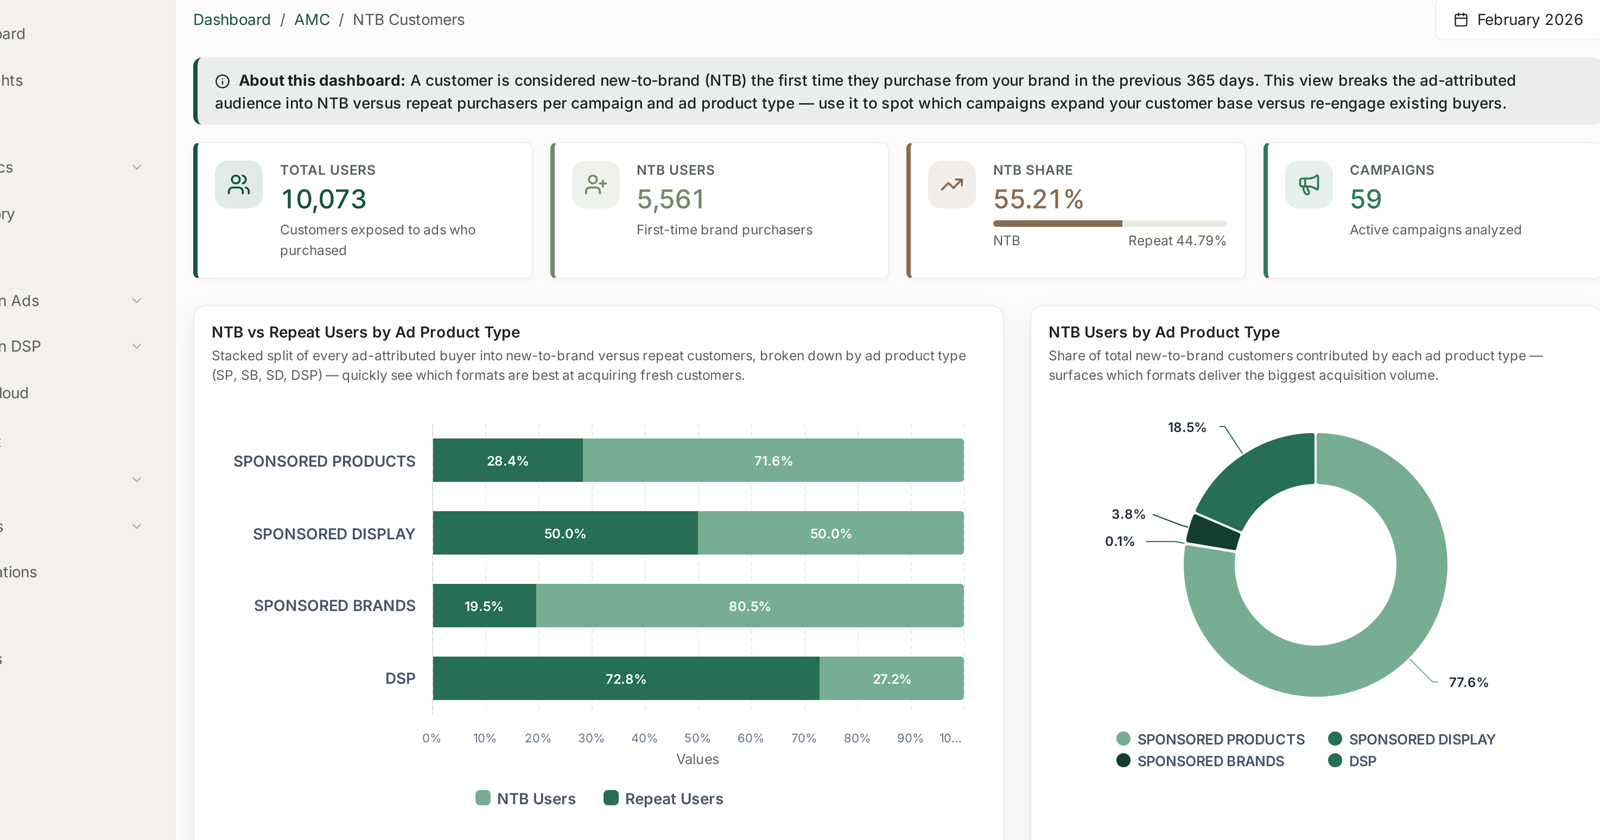
| Tile | Reads |
|---|---|
| Total Users | customers exposed to ads who purchased |
| NTB Users | first-time brand purchasers among them |
| NTB Share | NTB as a percentage, repeat beside it |
| Campaigns | active campaigns analysed |
Total Users is worth pausing on. It counts people who saw an ad and bought — not everyone reached. It is the denominator for the share, and it is much smaller than your impression counts.
Two charts, two different questions
The dashboard is built around a contrast that is easy to miss because both charts look like they are about the same thing.
NTB vs Repeat Users by Ad Product Type — a stacked bar per format:
Stacked split of every ad-attributed buyer into new-to-brand versus repeat customers, broken down by ad product type (SP, SB, SD, DSP) — quickly see which formats are best at acquiring fresh customers.
NTB Users by Ad Product Type — a doughnut:
Share of total new-to-brand customers contributed by each ad product type — surfaces which formats deliver the biggest acquisition volume.
The bars are a rate. The doughnut is a volume. They routinely disagree, and the disagreement is the finding.
Read the legend before the bars. Here NTB Users is the lighter segment and repeat is darker — the reverse of NTB Purchases, where the darker segment is the NTB one. All three NTB dashboards use different conventions.
The gap that matters
A representative month:
| Ad type | NTB rate | Share of all new customers |
|---|---|---|
| Sponsored Brands | 80.5% | 3.8% |
| Sponsored Products | 71.6% | 77.6% |
| Sponsored Display | 50.0% | 18.5% |
| DSP | 27.2% | 0.1% |
Sponsored Brands is the best recruiter and barely matters. Four buyers in five are new — and it delivers under 4% of the brand's new customers, because the volume is small.
Sponsored Products is the opposite. A lower rate, and more than three-quarters of every new customer the brand gained.
Both facts are actionable, and they point in different directions:
- The rate says Sponsored Brands is efficient at acquisition — give it more room and see whether the rate holds.
- The volume says Sponsored Products is your acquisition engine — do not let a cost-cutting exercise touch it.
A budget decision that reads only one chart gets this exactly wrong. Shifting money from SP to SB because SB has the better rate can shrink total acquisition even as the percentages improve.
The campaign table
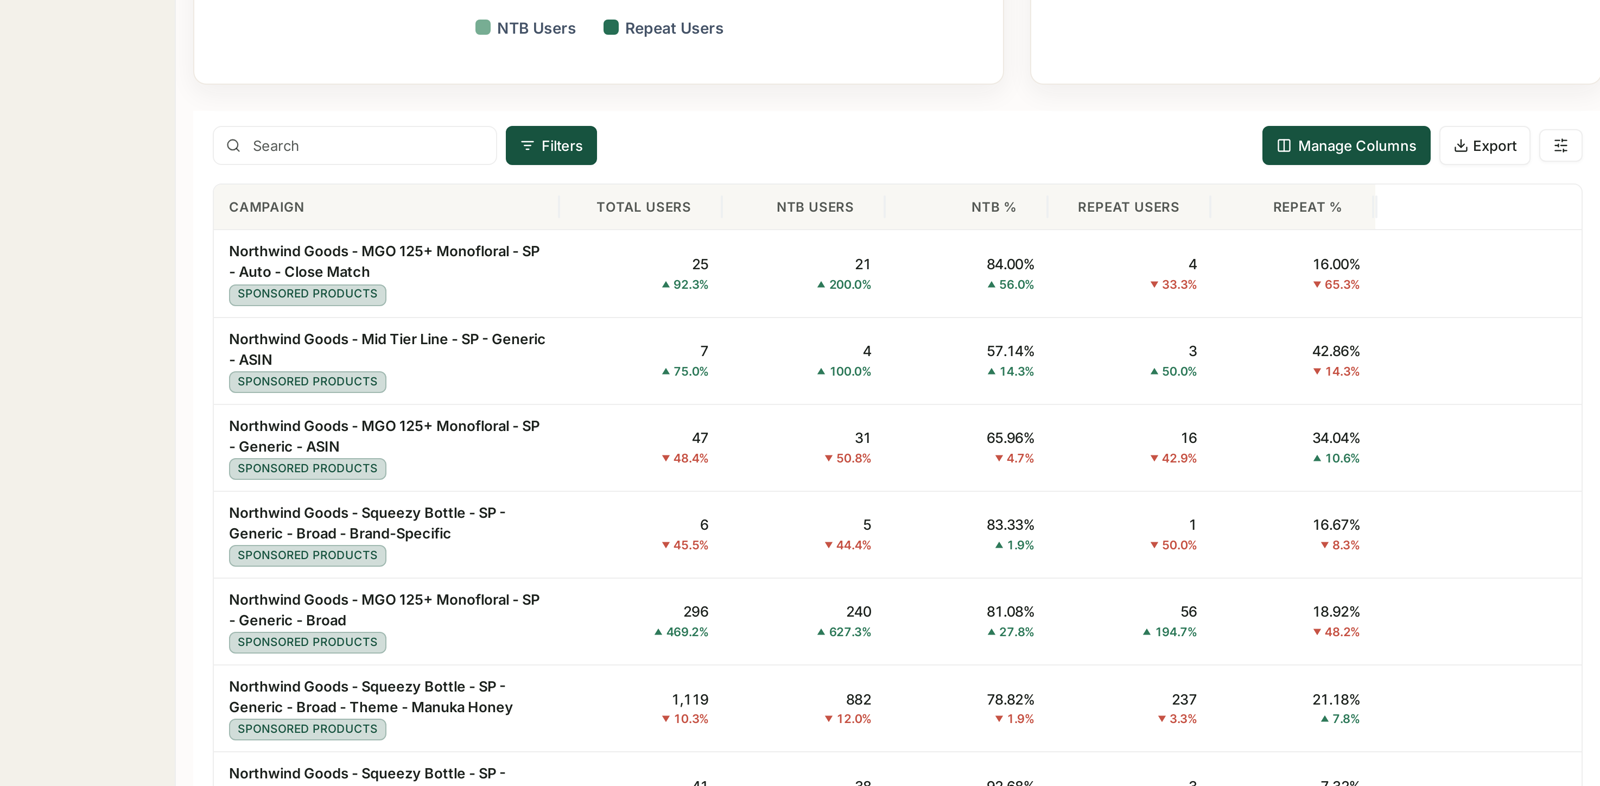
Beneath the charts, every campaign is listed with Total Users · NTB Users · NTB % · Repeat Users · Repeat %, each with a change against the previous month.
Read NTB Users and NTB % together, one campaign at a time. A campaign at 84% NTB on 25 users and one at 81% on 296 users are doing very different jobs at the same rate — and only one of them is moving the business.
DSP at 0.1% deserves a look
A near-zero share of new customers is not automatically a problem — it is what a remarketing-weighted DSP buy produces, by definition. But it is worth confirming that is the intent rather than an accident.
Open DSP Campaigns. If the campaign list is remarketing and retargeting with little or no prospecting, the number is explained. If there is prospecting spend and it still delivers no new customers, that is a genuine finding and the prospecting audiences need reviewing.
What to do with it
Track NTB Users, not just NTB share, month to month. The percentage can rise while the count falls — that is a shrinking business with a flattering ratio.
Work out what a customer costs. Total ad spend divided by NTB Users is a rough blended acquisition cost. Rough, because not every new customer came from an ad. It is still a far better planning number than ACoS for anything acquisition-shaped.
Compare it to your repeat rate. Acquisition only pays back if people come back. High NTB with low repeat is a leaky bucket, and the fix is the product and the listing, not the media plan.
What not to conclude
NTB does not mean incremental. These customers were new to the brand; the ad may not have caused the purchase.
The doughnut is share of NTB, not share of spend. A format with 0.1% of new customers may be taking a large share of budget — the chart will not tell you.
Do not reconcile it against NTB Purchases. Different definitions, different units. See the table in that article.
Related
- NTB Purchases: New Business by Campaign — the same split, counting orders.
- NTB ASINs Analysis — which products recruit.
- What 'New to Brand' Actually Means — the definition in full.
- Protect the products that bring you new customers — the playbook.