

Every other report in TrackIQ credits a sale to one campaign. Path to Purchase shows the whole sequence — every ad format a customer was exposed to, in order, before they bought.
It is the only dashboard that can tell you whether your formats are working together or simply taking turns claiming the same customer.
Prefer to watch? Eighty-one seconds on reading the NTB column instead of the sales column.
The headline numbers
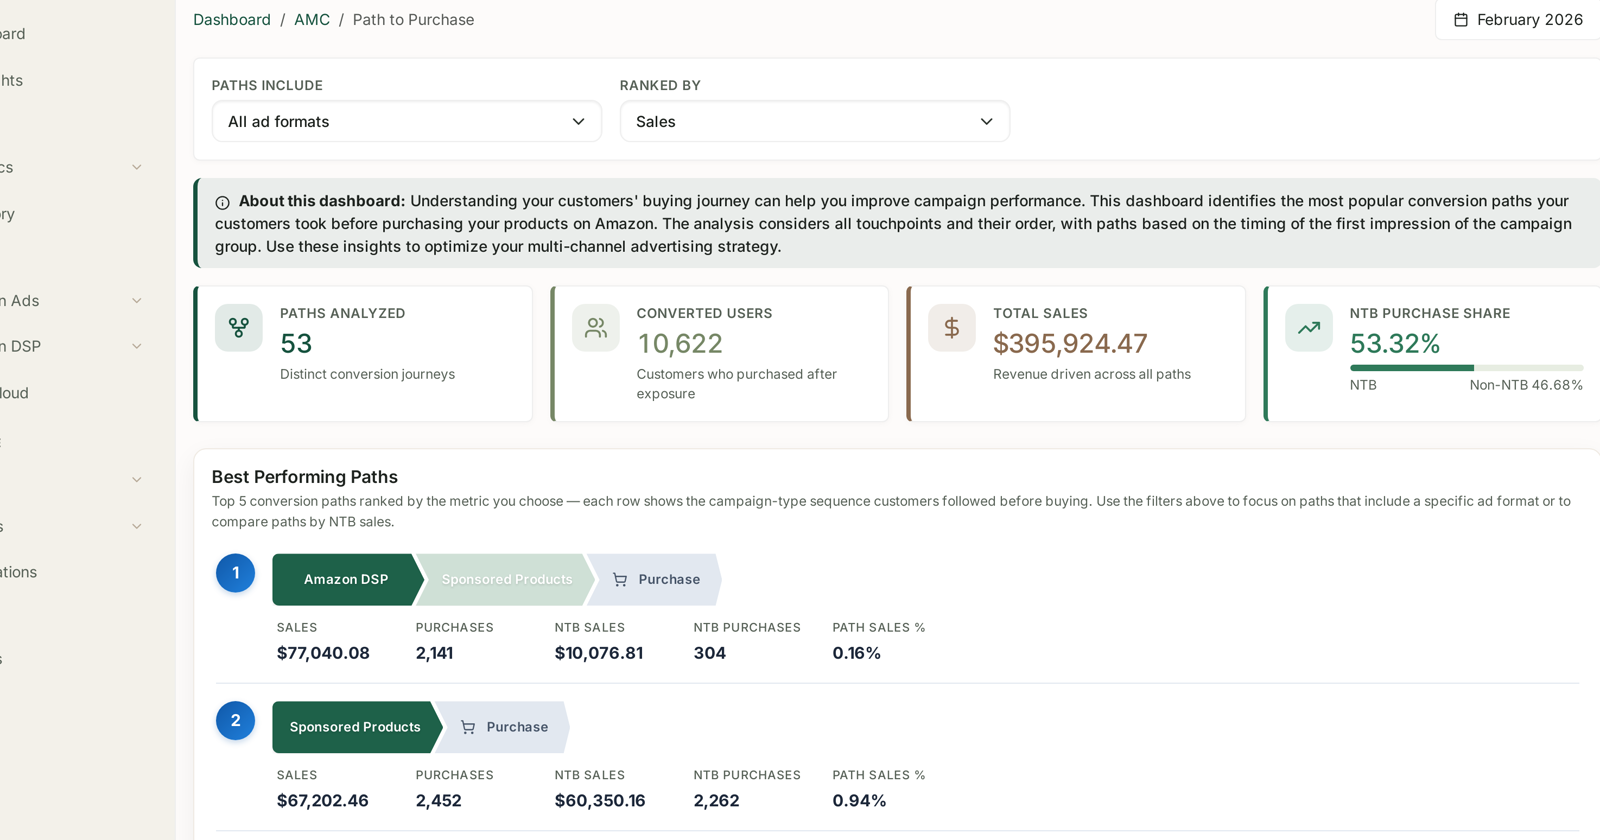
Two controls sit above: Paths Include (all ad formats, or only paths containing one) and Ranked By (Sales, and the other measures).
| Tile | Reads |
|---|---|
| Paths Analyzed | distinct conversion journeys |
| Converted Users | customers who purchased after exposure |
| Total Sales | revenue driven across all paths |
| NTB Purchase Share | how much of it was new-to-brand |
Fifty-odd distinct journeys is normal. Most of the volume lives in the top five.
Best Performing Paths
Top 5 conversion paths ranked by the metric you choose — each row shows the campaign-type sequence customers followed before buying.
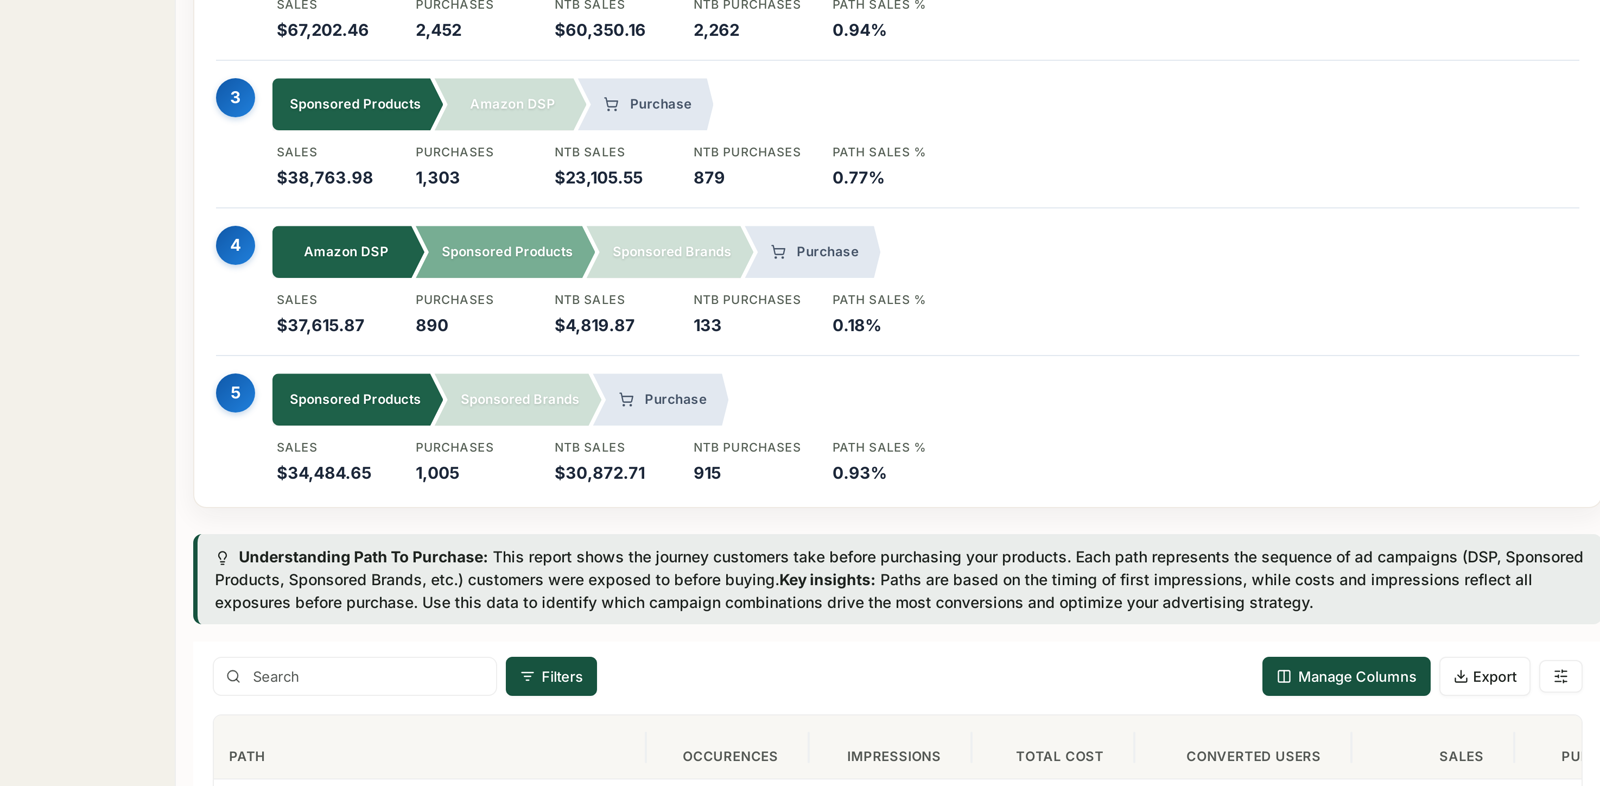
Each row is a sequence of chips ending in Purchase, with sales, purchases, NTB sales, NTB purchases and path sales % beneath it.
Read the NTB column, not the sales column
The paths ranked highest by revenue are frequently the worst at acquiring anybody. A representative month:
| # | Path | Purchases | NTB purchases | NTB rate |
|---|---|---|---|---|
| 1 | DSP → SP → Purchase | 2,141 | 304 | 14% |
| 2 | SP → Purchase | 2,452 | 2,262 | 92% |
| 3 | SP → DSP → Purchase | 1,303 | 879 | 67% |
| 4 | DSP → SP → SB → Purchase | 890 | 133 | 15% |
| 5 | SP → SB → Purchase | 1,005 | 915 | 91% |
The pattern is unmistakable once you sort by it: paths that begin with DSP are almost entirely repeat customers. Paths that begin with Sponsored Products are almost entirely new ones.
That is the opposite of the textbook, where display is the top of the funnel. It is what happens when a DSP buy is weighted toward remarketing and retargeting — those audiences are built from people who have already visited your pages, so DSP appears first in the path only because it re-reached somebody the brand already knew. See DSP Campaigns.
The path order tells you what your DSP is for. DSP appearing first on high-NTB paths would mean genuine prospecting. DSP appearing first on low-NTB paths means it is finding people you already have.
Single-touch beats multi-touch more often than you'd think
Path 2 — one format, straight to purchase — produced more purchases than path 1 and eight times the new customers.
This is worth saying plainly because multi-touch paths look more sophisticated. Before concluding that DSP "assisted" path 1, ask the harder question: would those 2,141 purchases have happened anyway? Path 2 suggests many of them would. The DSP exposure may be a cost added to a sale that was already coming.
The paths where multi-touch genuinely earns its place are the ones where the added format brings a materially better NTB rate than the same path without it. Compare path 3 (67% NTB) against path 2 (92%): adding DSP after SP made the journey less acquisitive here, not more.
The methodology caveat that matters
The dashboard states it, and it changes how you read the cost columns:
Paths are based on the timing of first impressions, while costs and impressions reflect all exposures before purchase.
So the sequence is ordered by when each campaign group first reached the customer, but the money attached to the row covers every impression along the way. A path can look expensive because of exposures that arrived late and contributed little to the ordering.
Treat the sequence as reliable and the per-path cost as indicative.
What to do with it
Filter to one format and compare. Set Paths Include to a single format, then look at paths with and without it. If the format never improves the NTB rate of the paths it joins, it is riding along.
Rank by NTB sales instead of sales. One dropdown change reorders the whole board around acquisition rather than revenue, and it usually promotes completely different paths.
Take the finding to budget. If DSP-first paths are 14% NTB and SP-first are 92%, the question is not whether to cut DSP — it is whether the prospecting half of DSP is funded at all. See Decide whether your upper-funnel DSP is worth keeping.
Check it against the other two dashboards. Low DSP NTB here should show up as low DSP NTB on NTB Purchases and NTB Customers. If all three agree, it is real.
What not to conclude
A path is not causation. It records exposure order, not influence. Somebody who scrolled past a display ad appears in the path.
Paths do not include organic. Only ad exposures are visible. A customer who found you through search and was later shown a display ad looks DSP-influenced here.
Top five is not all of it. Fifty-plus paths exist; the long tail is real, and the table below the chart holds it, with occurrences, impressions and total cost.
Monthly cohorts. One calendar month at a time, like every AMC dashboard.
Related
- Time to Conversion: Checking Your Attribution Window — how long the journey takes.
- NTB Purchases: New Business by Campaign — the same acquisition question by format.
- DSP Campaigns — checking which audiences your display spend bought.
- Why SP, SB and SD Numbers Don't Add Up — why single-campaign credit misleads.