

Insight reports are analysis for you. Business reports are for everyone else — the board, the client, the person who wants the headline without the dashboard. They carry your logo, and they come in two shapes.
Prefer to watch? Fifty-five seconds on choosing between dashboard and slides.
Three ways to start one

| Route | Use it when |
|---|---|
| Templates | a pre-built structure exists for what you need. The fastest start. |
| AI Report Generator | you can describe what you want in a sentence and would rather not assemble it. |
| + Create Business Report | you know exactly what you want and want control over it. |
Most people should start with Templates and adapt, rather than building from an empty report.
The list
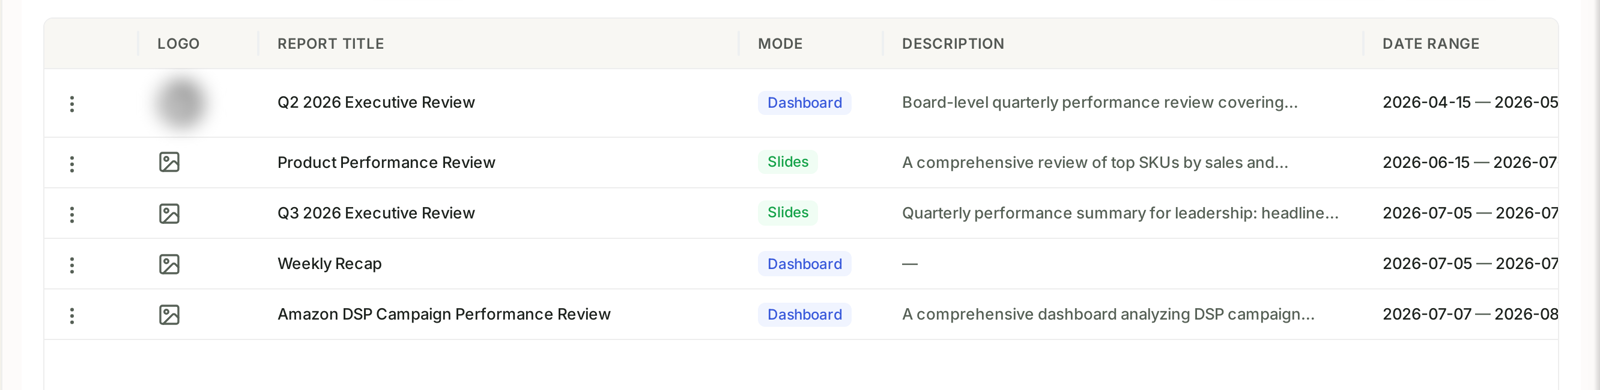
| Column | What it tells you |
|---|---|
| Logo | the branding on the finished report |
| Report Title | |
| Mode | Dashboard or Slides |
| Description | what the report is for |
| Date Range | the period it covers |
Dashboard or Slides: the decision that matters
Mode is the only real choice on this screen, and it should be made by who is reading, not by what the data is.
Dashboard mode produces something interactive. Use it when the reader will sit with it and click — a client who wants to explore their own numbers, or a colleague who will come back to it through the month.
Slides mode produces a deck. Use it when you will present it, or when it will be emailed and read once. A board pack is slides. A quarterly review you will walk someone through is slides.
The same data supports both, so if you pick wrong, the fix is a new report rather than new analysis.
Writing a description that earns its place
The Description appears in the list and often at the top of the report. It is worth writing properly, because in three months you will be looking at five similarly-named reports trying to remember which is which.
Good descriptions say who it is for and what it covers: “Board-level quarterly performance review”, “A comprehensive review of top SKUs by sales”. Bad ones repeat the title.
Your logo
Business reports carry a logo, which is what makes them presentable outside your team. If you manage several brands, check the logo is the right one before sending — it is set per report.
A cadence worth keeping
One Slides report on a monthly cadence for whoever you report to, and one Dashboard report per client or brand that they can open whenever they like.
That combination answers most reporting requests before they are made, which is the actual goal — not producing reports, but not being asked for them.
Related
- Business Report Templates and the AI Report Generator — templates and the AI generator.
- Weekly Business Reports and AI-Generated Insights — the weekly cadence.
- How to Create an AI-Powered Insight Report — the other report type.
- Build a Weekly Executive Summary You Never Have to Write — the playbook.
- Build a Monthly Board Pack — the monthly equivalent, for a different audience.
- Inventory Forecasting and Purchase Orders — turning sales history into a forecast.