

A board pack is not a bigger weekly report. The audience is different, the time horizon is different, and the questions are different — a board wants to know whether the business is working, not whether last Tuesday's ACoS was acceptable.
Built once, it should take under an hour a month.
Time: two hours to build. Under an hour monthly after that.
Prefer to watch? Eighty seconds on leading with total sales, and the two paragraphs nobody else can write.
Step 1 — Decide what the board is deciding
Every slide should serve one of three decisions. If it serves none, cut it:
Should we put more money in? — growth, acquisition, category momentum.
Is anything going wrong? — erosion, concentration risk, availability.
Are we spending well? — efficiency, but as context rather than the headline.
A board pack that opens with ACoS has misjudged the room. ACoS is an operating metric; it belongs in the appendix.
Step 2 — Lead with the whole business, not the advertised part
Analytics → Category Insights.
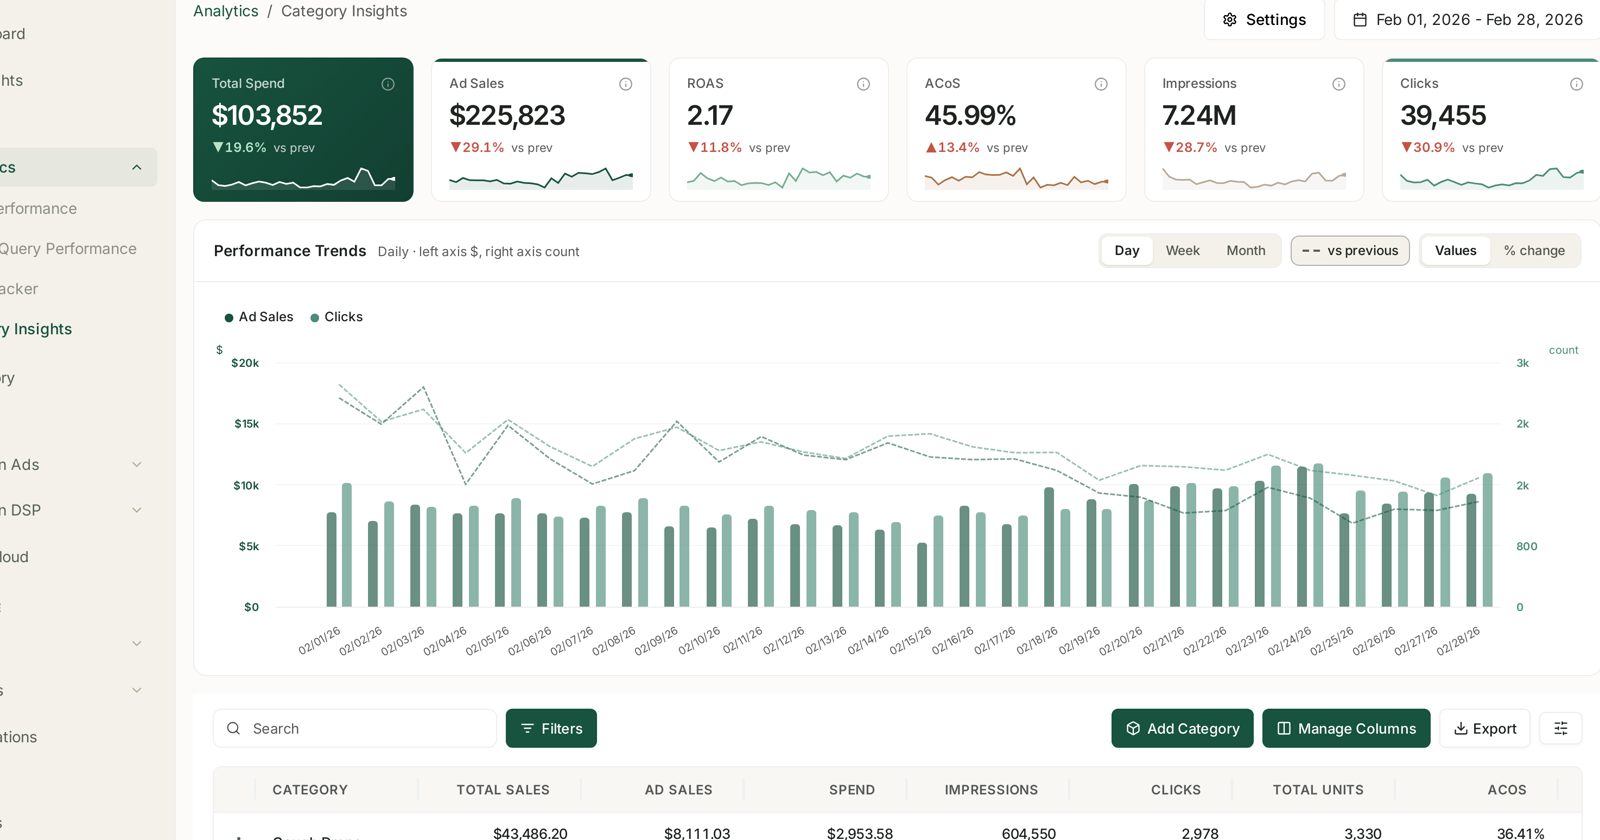
This is the right opening because it is the only screen with Total Sales beside Ad Sales, which lets you show TACoS — how much of the business is bought.
Per category, month over month and against the same month last year:
Total sales, then TACoS, then total units. Three numbers, one table.
The reading that earns its slot is the divergence: ad sales rising while total sales stays flat means advertising is replacing organic rather than adding to it. That is a strategic finding, and it is invisible on every advertising screen. See Benchmark Yourself Against Your Own Category.
Step 3 — Show acquisition, not just sales
AMC Cloud → NTB Customers.
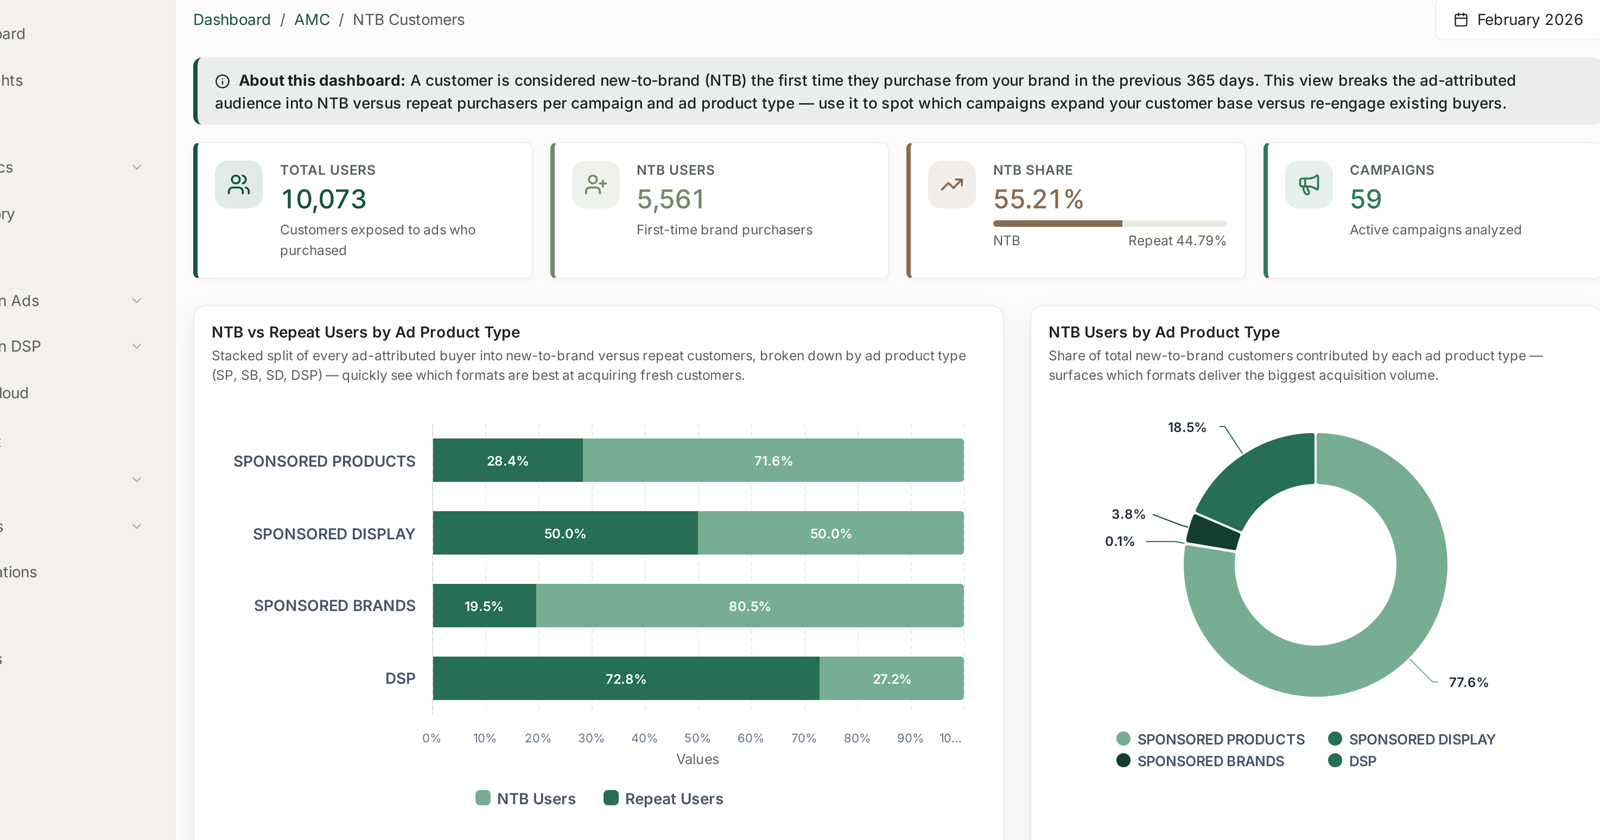
NTB Users is the closest thing to a growth metric the account produces, and most board packs never include it.
Show the count month over month, not just the share — a percentage can improve while the absolute number of new customers falls, which is the worst outcome wearing the best-looking number.
If you want one derived figure, blended acquisition cost — total ad spend divided by NTB users — is rough but far more board-relevant than ACoS. Say that it is rough.
Step 4 — Name the risks
Boards remember the pack that told them about a problem before it arrived. Two are worth a standing slide:
Concentration. If a small number of ASINs bring most of your new customers, say so and show the number. That is a real dependency, and it belongs in a risk register rather than in an ads report. See NTB ASINs Analysis: Finding Your Gateway Products.
Availability. Days of cover on the products that matter, and any stock-out that happened during the month with what it cost in rank. See Catch a Stockout Before It Costs You Rank.
Step 5 — Build it once, in a template
Business Reports → AI Report Generator, then save the result.
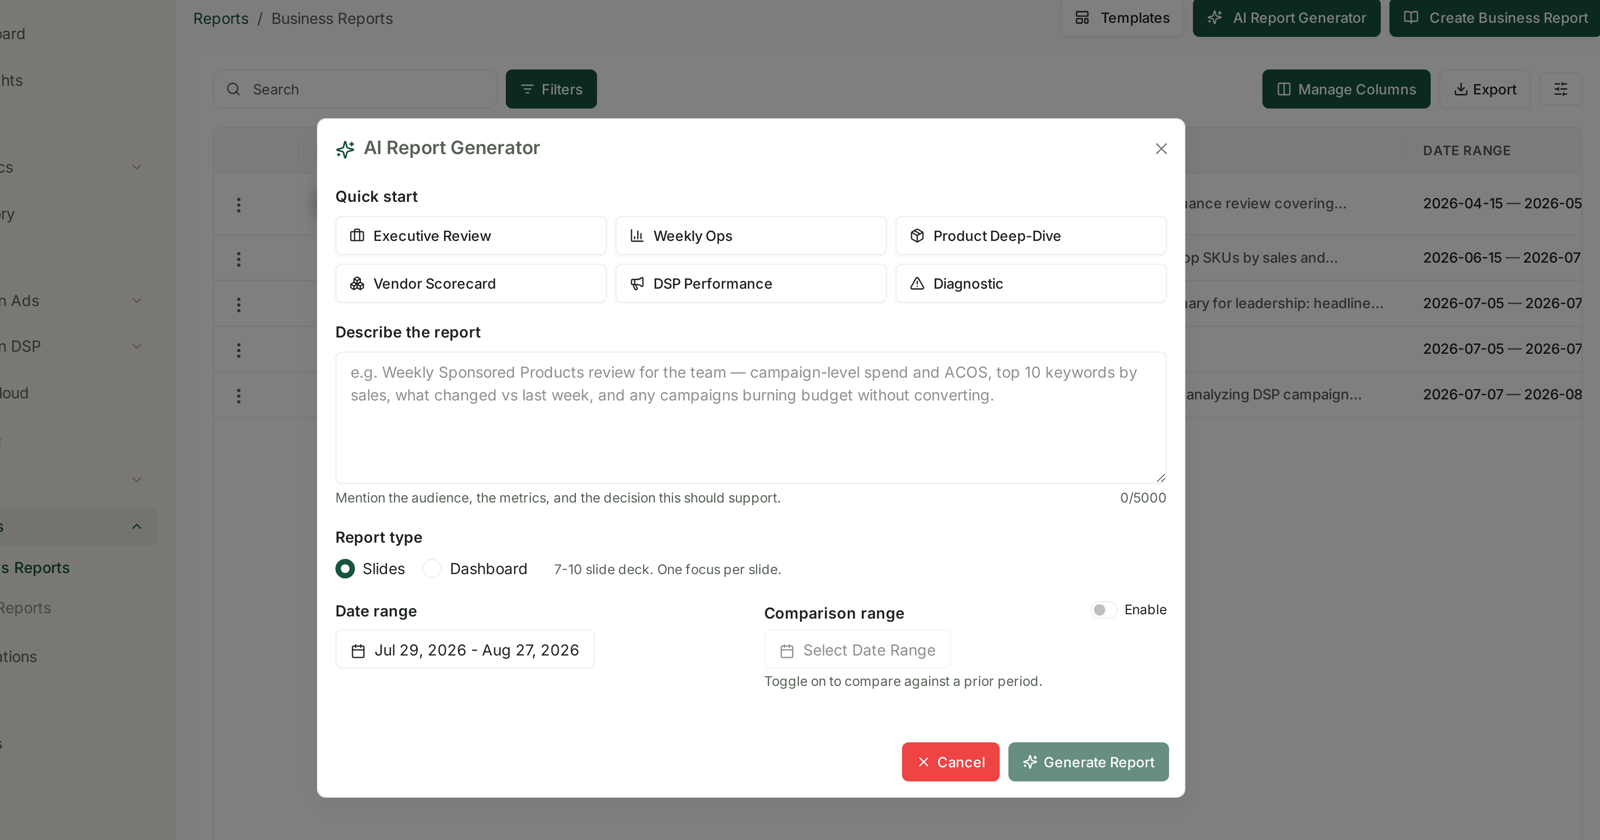
Start from Executive Review, choose Slides, and describe it with the audience and the decision named:
Monthly board pack. Total sales and TACoS by category against last month and the same month last year, new-to-brand customers by month, the ASINs driving acquisition, and any stock cover below four weeks. The decision is next quarter's investment.
Turn on the comparison range. For a board pack this is not optional — a monthly number with nothing beside it is not information.
Then ⋮ → Save as Template, and next month starts from a known-good structure. See Business Report Templates and the AI Report Generator.
Step 6 — Write the two paragraphs nobody else can
The pack's numbers will be right and its interpretation will be generic. That is the half you supply:
What changed, and why. One paragraph. Not what the numbers did — what caused them.
What we are doing about it. One paragraph. The decisions already taken, so the meeting starts from action rather than from explanation.
Aria can draft the first — "what changed most vs last month and what caused it?" — but read it before it goes in. See Checking Aria's Work When an Answer Looks Wrong.
A structure that holds up
| Slide | Content |
|---|---|
| 1 | Headline: total sales, growth, one sentence |
| 2 | Category performance — total sales and TACoS |
| 3 | Acquisition — NTB users by month |
| 4 | Risks — concentration and availability |
| 5 | What we are doing about it |
| Appendix | Efficiency: ACoS, spend by format, campaign detail |
Five slides and an appendix. The appendix is where you put everything you would be asked about but should not lead with.
What not to do
Do not lead with ACoS. It answers a question the board did not ask.
Do not change the structure monthly. A board reading the same shape each month spots change instantly. A board reading a new layout spends the meeting orienting.
Do not present a number without a comparison.
Do not hide a bad month. The pack that surfaces a problem early buys you the credibility to be believed about the next one.
Do not send it unread. A generated pack read first by its audience is how a wrong number becomes a board decision.
A note on delivery
There is no email scheduling for reports today, so producing from the template and sending it yourself is the current path. It takes minutes once the template exists.
Related
- Business Report Templates and the AI Report Generator — step 5.
- Benchmark Yourself Against Your Own Category — step 2.
- NTB Customers: New vs Repeat, Counted as People — step 3.
- Build a Weekly Executive Summary You Never Have to Write — the weekly sibling.