

You cannot relaunch everything at once. The product comparison table exists to decide which one or two products get your attention, your budget and your time — and to make that decision on evidence rather than on which product you happen to like.
The central question is not "which product is best?" It is "which product has the strongest offer relative to the competitors it is actually up against?"
Because a strong offer is what makes a relaunch succeed. A weak offer pushed hard just spends money.
Prefer to watch? One hundred and sixty-one seconds on the four elements of an offer, building the comparison per candidate, and weighting offer and margin above everything else.
What "offer" means here
Four things, judged against your direct competitors — not in the abstract:
Price and value for money — your price against what you actually provide.
Main image — quality and appeal, which decides your click-through — see Why the Main Image Decides Your CTR.
Review count.
Rating.
The stronger you are on these four relative to your competitors, the more likely a shopper picks you — and the more likely you can hold a higher position once you get there.
Step 1: shortlist your candidates
Pick the best products in your catalogue, on three criteria:
Higher sales volume is better.
More reviews is better.
Higher margin is better — minimum 33% gross margin before PPC.
Two practical ways to draw the shortlist: the top four products by net margin last month, or the four products with 300+ reviews.
Below 33% gross margin before PPC there is not enough room to fund a launch, so those products are not candidates regardless of how appealing they look.
Step 2: build one comparison per product
One tab per candidate, named after its main keyword.
Find 7–10 direct competitors for each — genuinely similar products, not merely the same category.
Then record, per competitor and for yourself:
| Column | What goes in it |
|---|---|
| Price | competitor's listed price |
| Units / size | how much they give you for it |
| Price per unit | price ÷ units |
| Reviews | count |
| Rating | stars |
| 30-day sales | to place yourself in the top 10 |
| Search volume trend | 90-day growth for the niche |
| Inventory | your units in Amazon + 3PL |
Price per unit is the column people skip and the one that decides it. A 4-pack at $10 is $2.50 a unit; a 5-pack at $11 is $2.20 and a better offer, despite the higher shelf price.
Search volume trend comes from Product Opportunity Explorer — Seller Central → Growth → Product Opportunity Explorer, searched on the main keyword, then read the search volume growth percentage for the last 90 days.
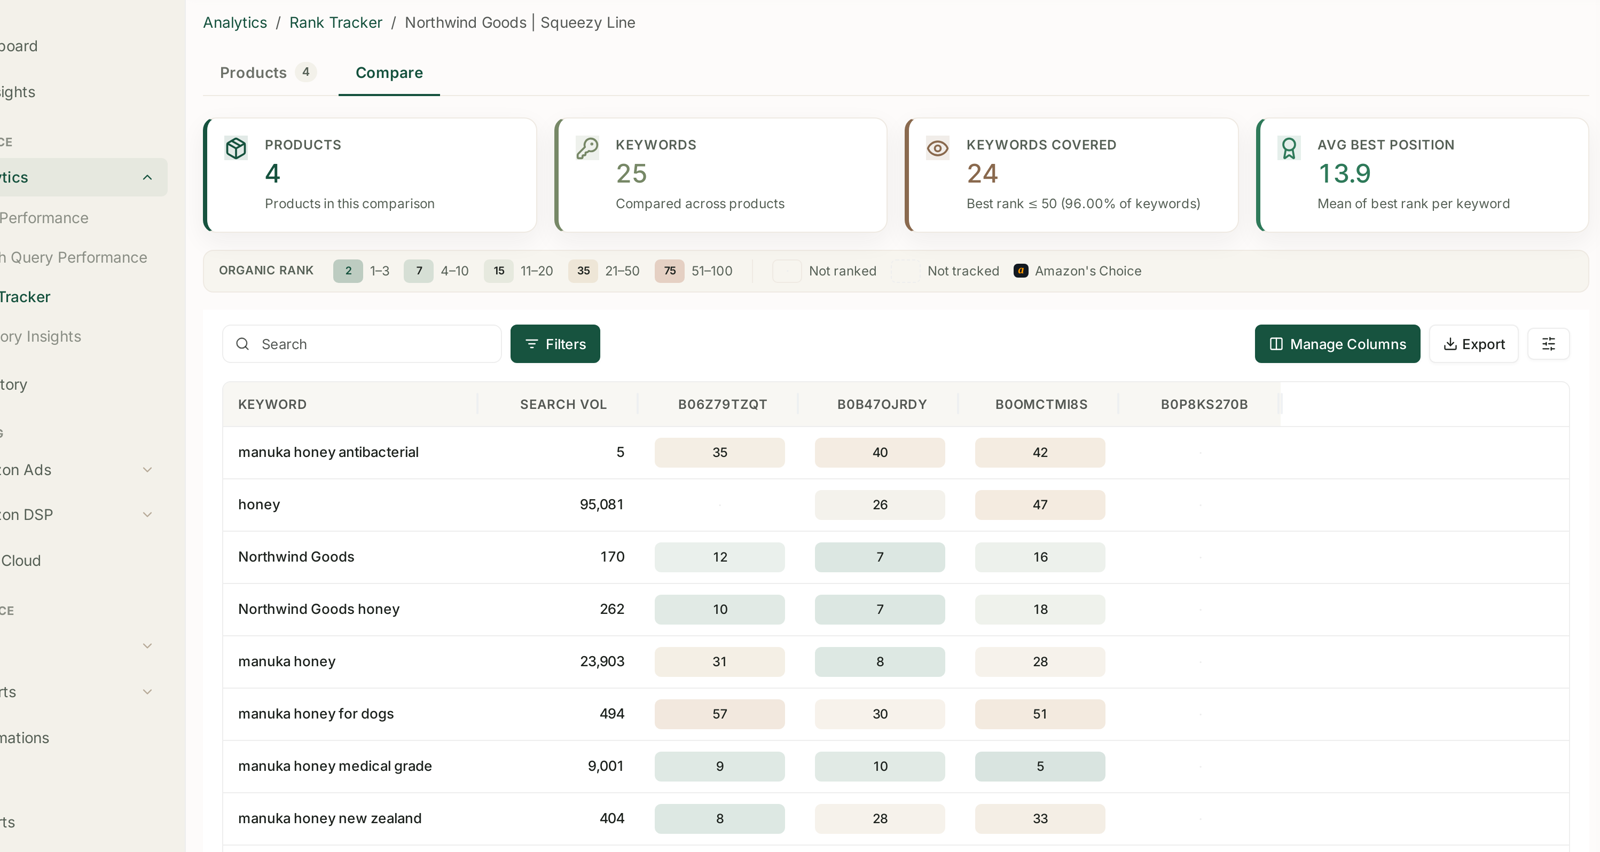
Sales, rank, review count, rating and price for you and ten competitors, in one place, is exactly what the comparison view produces — see Tracking Competitor ASINs Alongside Your Own and Category Insights. Assembling it by hand across four candidate products and forty competitors is a day's work that goes stale within a fortnight.
Step 3: read the table
Bring every candidate's answers onto one summary sheet, then compare across products:
| Criterion | How to read it |
|---|---|
| Price / value for money | lower rank is better — you want the strongest offer |
| Reviews | lower rank is better — you want the most reviews |
| Sales to grow to | higher is better — more headroom in the niche |
| Rating | higher than competitors = best, level = fine, lower = avoid |
| Search volume growth | higher is better |
| Gross profit margin | higher is better |
Mark the winner on each criterion, then pick one or two products.
How to weigh them
Offer and gross margin matter most.
If margin is very high but the offer is weak, the fix may be price. Cutting price strengthens the offer directly, and there is usually room to do it while staying in a healthy 33–42% band — see Pricing and Gross Margin.
Being in the top 3 on review count materially raises your chances.
Strong search volume growth is a genuine tailwind — the niche is expanding while you push into it.
A rating below your competitors is close to disqualifying. Rating is the hardest of the four to move quickly, and launching into a rating deficit means paying for traffic that converts worse than the competition — see Why a Rating Drop Costs More Than It Looks.
Then take one or two. Not four. The whole point of the exercise is concentration.
Common mistakes
Comparing against the category rather than 7–10 genuinely direct competitors.
Comparing shelf price instead of price per unit.
Choosing the product you like, and using the table to justify it afterwards.
Launching into a rating deficit because the other numbers looked good.
Ignoring the margin floor, and launching a product with no room to fund advertising.
Picking four products and giving none of them enough budget or attention to work.
Related
- Reviving a Sleeping Product — where this selection step is used.
- Designing the Offer — improving the thing you just measured.
- Scoring Product Opportunities — the same discipline applied to new products.