

Most people can define ACoS, ROAS, TACoS, CTR and CVR and still not say which one to act on. Each answers a different question, and reaching for the wrong one leads to the wrong decision.
Prefer to watch? A minute on which metric answers which question.
ACoS and ROAS are the same thing

ACoS is spend ÷ ad sales. ROAS is ad sales ÷ spend. They describe one relationship from opposite ends.
If your ACoS is 50%, your ROAS is 2.0. Always. Watching both is watching the same number twice.
Use whichever your team thinks in. What neither tells you is whether the business is becoming more dependent on advertising.
TACoS is the one to watch over time
TACoS is spend ÷ total sales — everything you sold, advertised or not.
This is the number that shows a slow problem:
| ACoS | TACoS | |
|---|---|---|
| Measures | how efficient the advertising was | how dependent the business is on it |
| Moves when | a campaign's performance changes | your organic sales change relative to paid |
| Best used | week to week | month to month |
A healthy ACoS can sit alongside a climbing TACoS, and that combination is worth catching. It means advertising is working fine, but a larger share of your revenue now requires paying for it — organic demand is eroding underneath a perfectly good campaign.
ACoS will never show you this. Only TACoS will.
When efficiency drops, the diagnosis is CTR and CVR
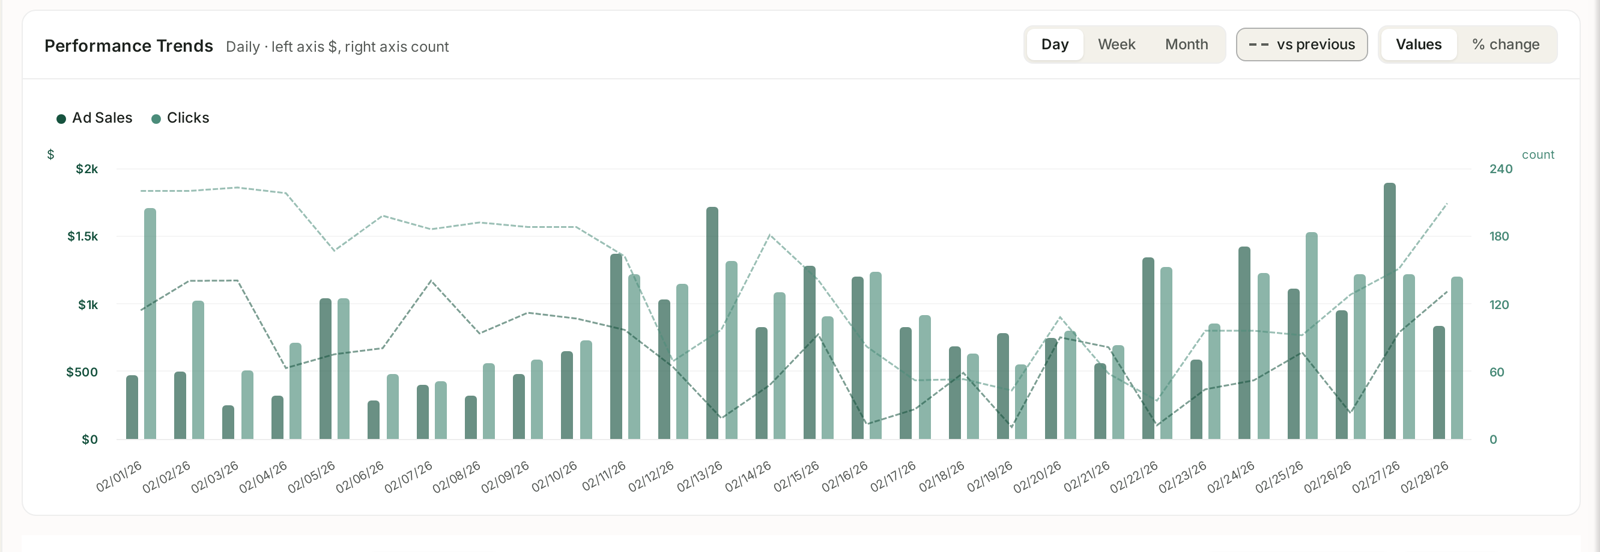
ACoS rising tells you something is wrong. It does not tell you what. These two do:
| What moved | Where the problem is | What to change |
|---|---|---|
| CTR fell | the ad | creative, keyword relevance, or you are showing to the wrong searches |
| CVR fell | the listing | images, price, reviews, availability |
| CPC rose, both steady | the auction | competitors bidding up — a business decision, not a fault |
That third row is worth naming, because it is often misread as a performance problem. If your click and conversion rates are unchanged and your ACoS still rose, nothing broke — the market got more expensive. Your decision is whether the traffic is still worth the new price.
The trap: comparing across ad types
Sponsored Products uses a 7-day attribution window. Sponsored Brands and Display use 14 days.
So Sponsored Brands has twice as long to be credited with a conversion, and its ACoS will tend to look better for that reason alone. Compare like with like — SP against SP, SB against SB. See Why Sponsored Products, Brands and Display Numbers Do Not Simply Add Up.
The same applies to recent data: a Sponsored Brands campaign from three days ago has eleven days left to accumulate sales, so judging it today will make it look far worse than it is.
What good looks like
There is no universal target. A correct ACoS depends on your margin, and on what you are trying to do:
- Defending a position — a higher ACoS can be rational; you are paying to hold ground.
- Harvesting profit — ACoS should sit comfortably inside your margin.
- Launching — ACoS is expected to be poor. You are buying sales history and rank.
The useful question is not “is 45% good?” but “is this campaign doing the job I set it?”
And if the answer is that you want a target enforced automatically, Rule-Based Optimization has a Hit my Target ACoS recipe that scales each bid by how far it sits from your target.
Related
- Monitoring Your Sponsored Ads Performance — the screens these metrics appear on.
- Amazon PPC: Core Terms and Metrics — the same metrics, taught from the ground up.
- What Amazon PPC Is Actually For — why TACoS is the honest measure of an account.
- Setting Target TACoS per Product — choosing a target rather than reading one.